
Figure 2.
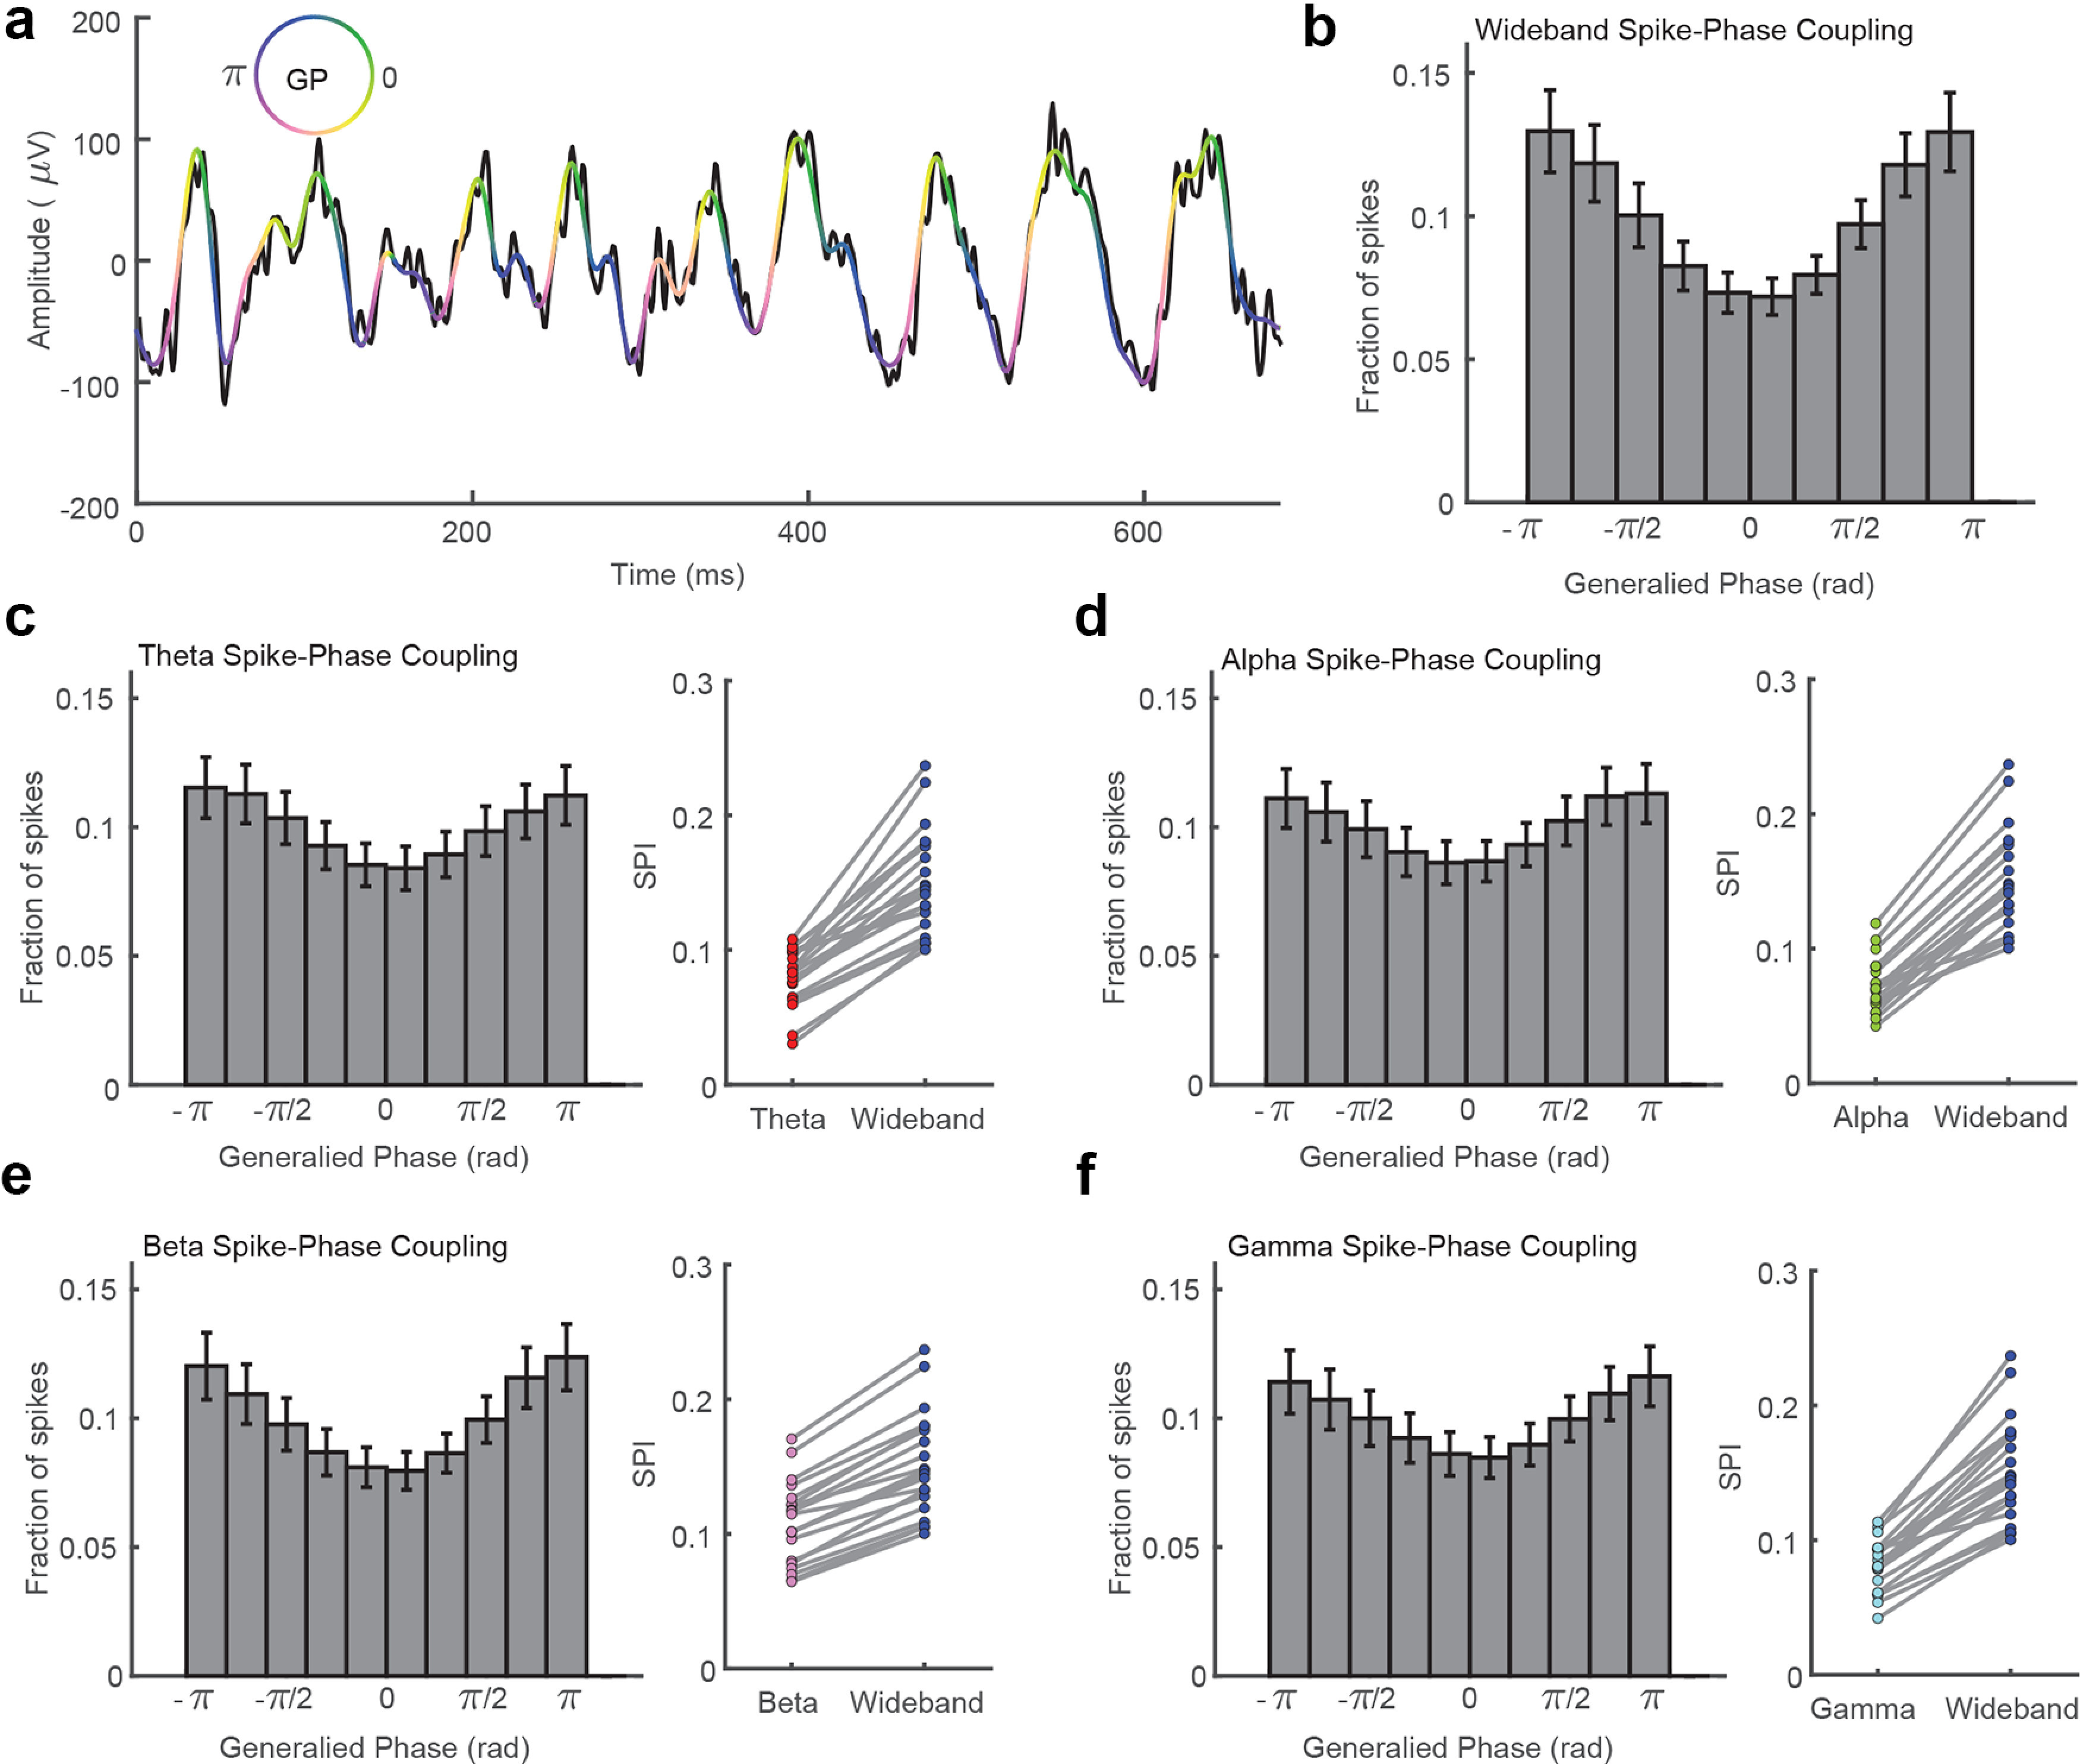
Spikes are more strongly coupled to the phase of wideband filtered LFP signals than narrowband oscillatory components. a, The raw (5–200 Hz) filtered LFP trace from Figure 1 is plotted in black. The wideband filtered trace (5–50 Hz) is plotted in pseudocolor corresponding to the GP of the wideband filtered trace according to the color wheel. GP captures the troughs (blue/purple) and peaks (yellow/green) of the dominant fluctuations while interpolating over the higher frequency, lower amplitude riding cycles. b, Histogram showing the fraction of spikes that occurred during different phases of the wideband filtered LFP (10 phase bins, N = 20 sessions across two monkeys. Error bars indicate SEM. c, The spike-phase distribution was flatter for theta band (4–8 Hz) filtered LFP. The mean SPI, which quantifies the mean vector length of the circular distribution of spike phases, is plotted across 20 sessions from two monkeys. The wideband filtered LFP (blue) had significantly stronger SPI values than theta filtered LFP (red, p < 1 × 10⁻⁹, 2-tailed paired sample t test). d–f, Same as c but for alpha (green, p < 1 × 10⁻¹⁰), beta (pink, p < 1 × 10⁻¹¹), and gamma filtered LFP (cyan, p < 1 × 10⁻⁹).