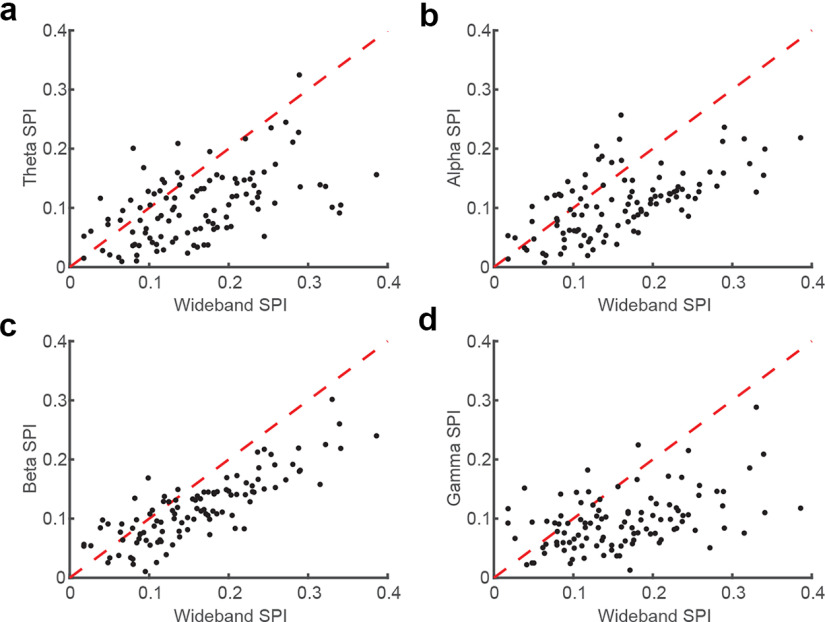
Figure 3.
Stronger wideband spike-phase coupling is consistent across the population of recorded single-units. a, Scatter plot comparing the magnitude of SPI after use of a broadband filter (x-axis) or theta band filter (y-axis) for each identified single unit (N = 107 across 20 recordings sessions). b–d, Same as for a but for alpha, beta, and gamma filters. The wideband filter had a consistently stronger SPI than the narrowband filtered oscillatory phases across the population of single units.

