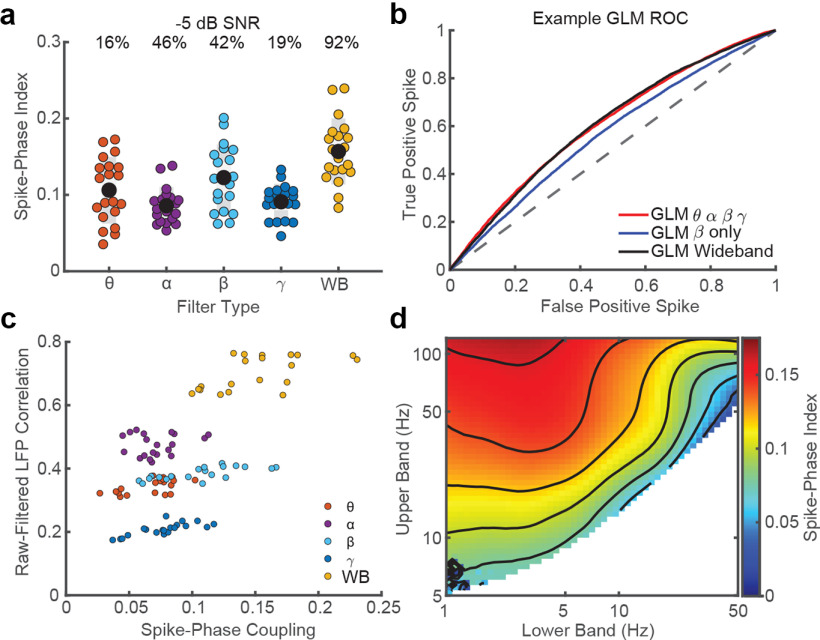
Figure 4.
Narrowband signals do not contain more spike-phase information. a, SPI values after restricting the inclusion of spikes to when significant power is present in each individual filter band (−5 dB SNR threshold, percentages indicate fraction of data above threshold; colored dots are N = 20 sessions from 2 monkeys; black dots are the population mean). b, Representative ROC curves for GLM analyses comparing model sensitivity for identifying spike times based on phase, computed in four narrowband frequency ranges that tile the frequency space from 4 to 50 Hz (red), a single measure of narrowband oscillatory phase (blue), or the single wideband GP measure applied to the same frequency range as the four-factor GLM (black). There was no significant difference between the four-factor and wideband models in identifying spike times based on phase (Wilcoxon signed-rank test, p = 0.16), whereas the single best narrowband model was significantly weaker (beta, p = 0.00008). c, Scatter plot comparing the correlation between the raw LFP and the filtered LFP signal (y-axis) and the SPI after filtering (x-axis) in each filter band. There was a significant positive correlation between SPI and how similar the raw LFP was with the signal after filtering (Pearson's r = 0.65, p < 1 × 10⁻¹²). d, SPI for a range of bandpass filters ranging in high pass (lower band, 1–50 Hz) and low pass (upper band, 5–125 Hz). Each pixel is color coded with its average SPI across each recording session (N = 20 sessions from 2 monkeys). White pixels are filter combinations that have bandwidths <4 Hz. Black contour lines denote SPI intervals (0.02).

