Figure 6.
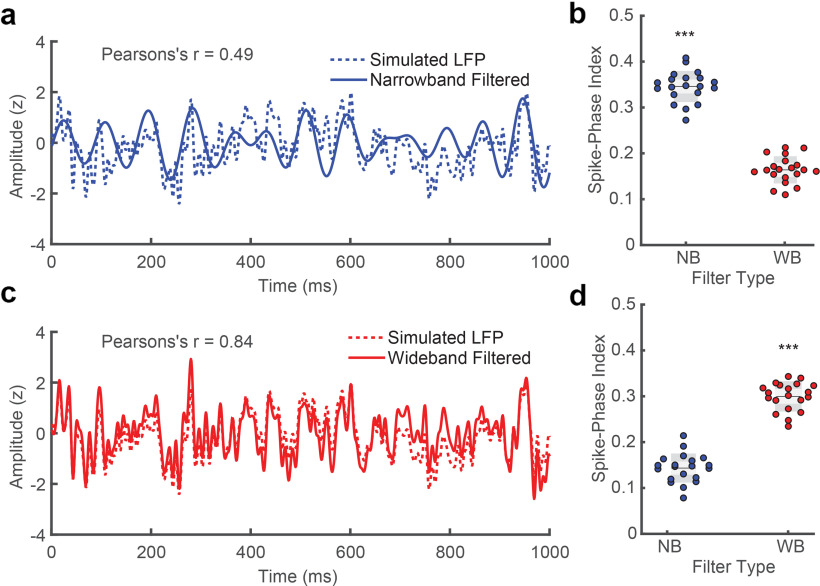
Spike–phase relationship is best recovered when the filter matches the signal. a, The 8–15 Hz narrowband filtered LFP (solid blue line) is the recovered spike-generating signal from the ensemble simulated LFP (dotted blue line) under hypothesis A (from Figure 5). b, The SPI from the phase of the narrowband signal is significantly stronger after narrowband filtering as compared with wideband filtering for the simulation where spikes were coupled to the phase of the narrowband component (5–100 Hz; N = 20 simulations; Asterisks indicate significance at p < 0.0001 2-tailed Wilcoxon signed-rank test). c, The wideband filtered LFP (5–100 Hz, red line) is the recovered spike-generating signal from the broadband simulated LFP under hypothesis B (from Figure 5; dotted red line). d, The SPI from the phase of the wideband is significantly stronger after wideband filtering as compared with narrowband filtering for the simulation where spikes were coupled to the phase of the broadband LFP (p < 0.0001, 2-tailed Wilcoxon signed-rank test).

