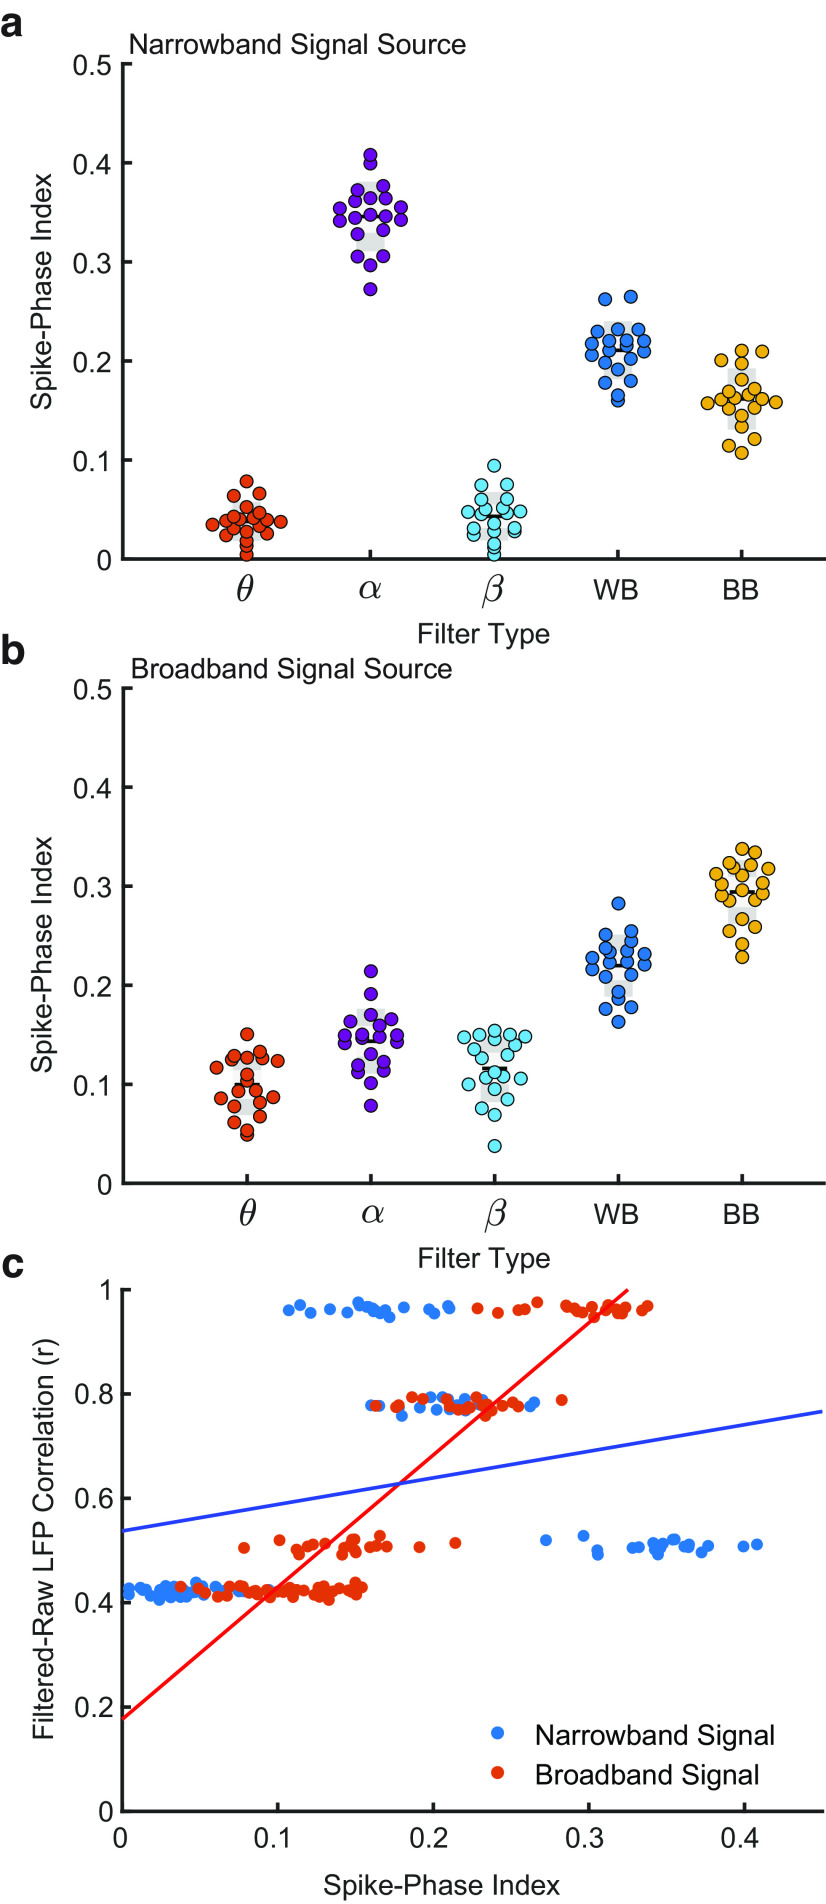
Figure 7.
The model with a broadband spike correlation best matches cortical recordings. a, SPI values after filtering simulated LFP in various band passes when spike times are correlated to the phase of 8–15 Hz narrowband component. In this case, the optimal filter is aligned to the signal source (8–15 Hz). b, Same as a but when spike times are coupled to the phase of the broadband LFP. The pattern of SPI across filters is well matched to the pattern observed in data (Fig. 4c). c, SPI (x-axis) is poorly correlated with the similarity between filtered and raw simulated LFP (y-axis) when spikes are correlated with narrowband signal phase (blue dots, r2 = 0.08). Conversely, the correlation is strong when spikes are correlated with broadband signal phase (red dots, r2 = 0.85). The relationship for a broadband signal source is well matched to the pattern observed in the cortical recordings (Fig. 4c).

