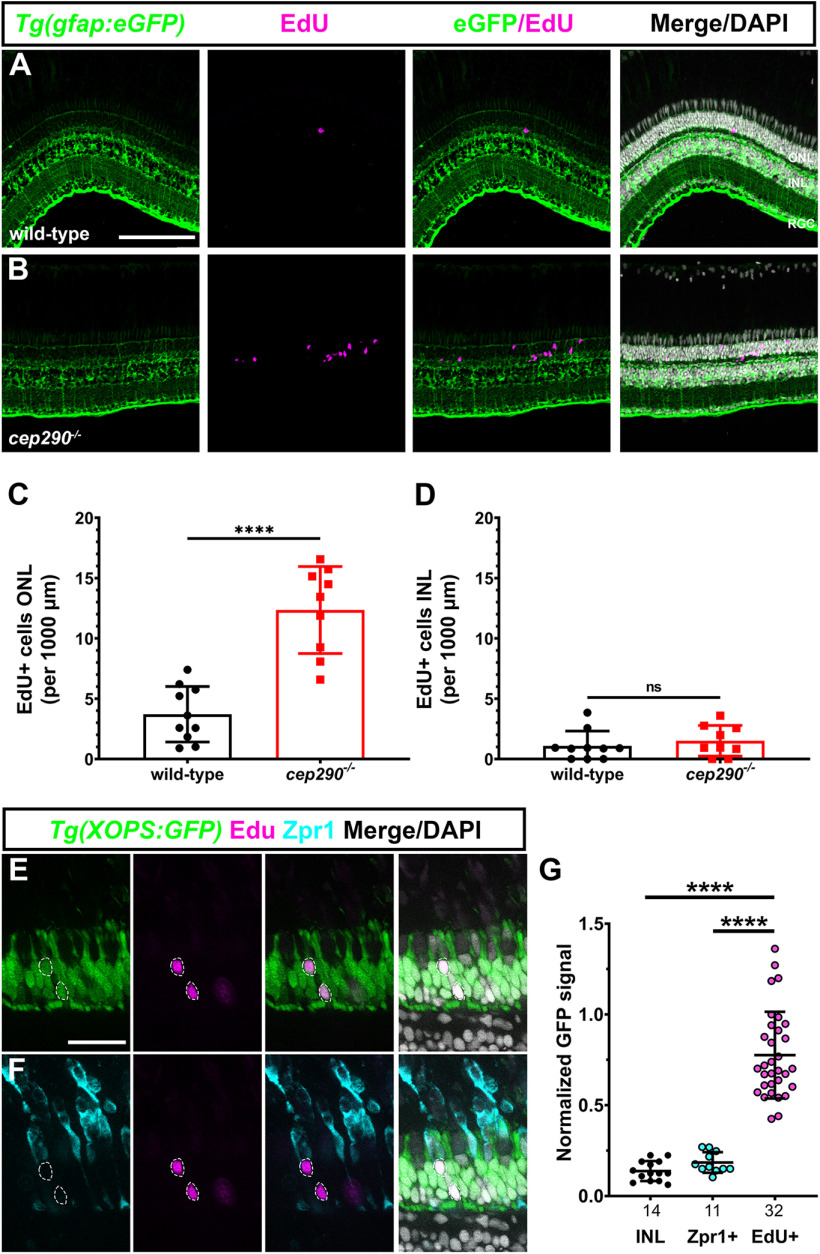
Figure 1.
Cell proliferation occurs by rod precursors in cep290 mutants. A, B, EdU labeling (magenta) in retinas from 6 mpf wild-type and cep290 mutants on the transgenic reporter line Tg(gfap:eGFP)mi2002 to label MG (green). Almost all EdU+ cells in cep290 mutants were located in the ONL. C, D, Quantification of EdU+ cells in the ONL and INL, respectively, of wild-type and cep290 mutants. Data are plotted as mean ± SD and p-values were generated by Welch's t test (ONL) or Mann–Whitney test (INL). ****p < 0.0001, ns = not significant. E, F, Single optical slices showing EdU labeling (magenta) and Zpr1 immunoreactivity (cyan) in retinas from 6 mpf cep290 mutants on the transgenic reporter line Tg(XOPS:eGFP)fl1, which labels rod photoreceptors (green). EdU+ cells (dashed circles) colocalized with rod nuclei but not in Zpr1+ cells. G, The normalized GFP fluorescence signal from the Tg(XOPS:eGFP)fl1 transgene was quantified in cells located the INL, in Zpr1+ cells, and EdU+ cells. N values are indicated on the graph. GFP signal was significantly higher in EdU+ cells than in Zpr1+ cells or in cells in the INL. Data are plotted as mean ± SD and p-values were generated by Welch's ANOVA test with Dunnett's T3 multiple comparisons test. ****p < 0.0001. ONL = outer nuclear layer; INL = inner nuclear layer; RGC = retinal ganglion cell layer. Scale bars: 100 µm (A, B) and 25 µm (C, D).

