
Figure 3.
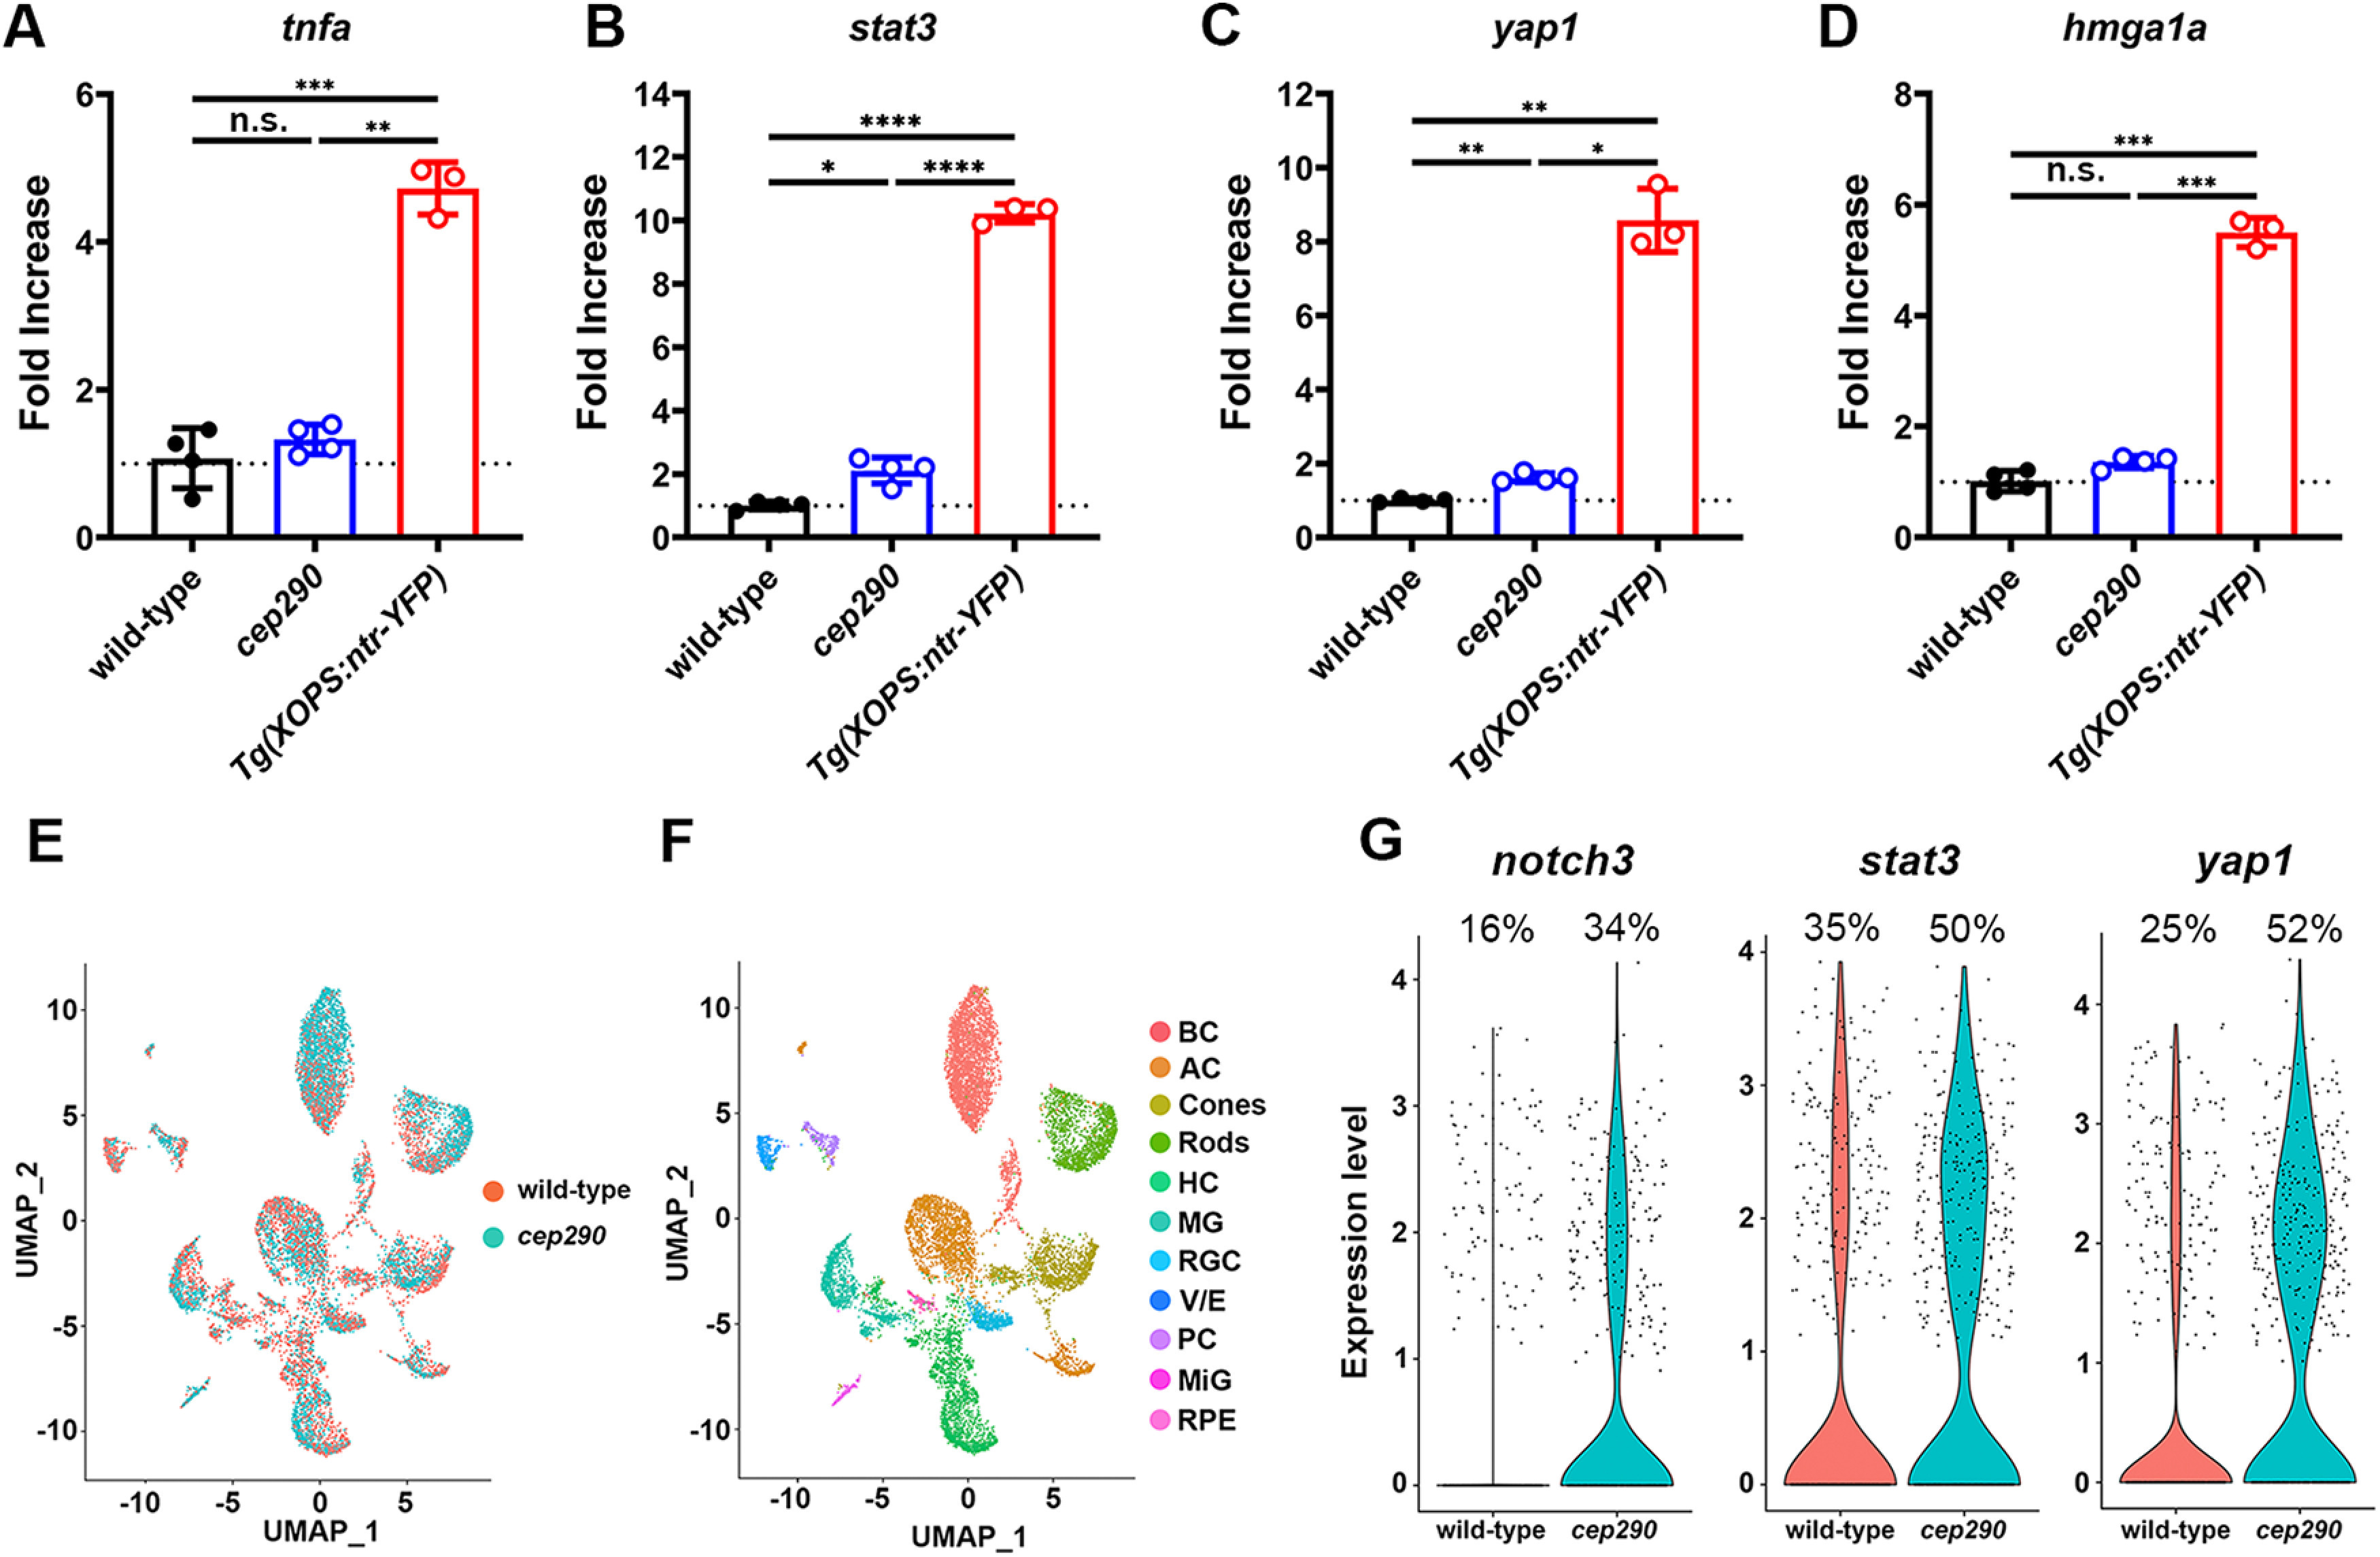
Expression of proregeneration genes was only modestly upregulated in 6 mpf cep290 mutants. A–D, qPCR for tnfa, stat3, yap1, and hmga1a in 6 mpf wild-type and cep290 mutant zebrafish. Gene expression in MTZ-treated Tg(rho:ntr-YFP)gmc500 zebrafish was used as a positive control for MG reactivity. Fold changes were calculated by the ΔΔC(t) method, with 18S rRNA used for normalization. No significant difference (n.s.) was observed between wild-type and cep290 mutants for tnfa (p > 0.63) or hmga1a (p > 0.06). cep290 mutants upregulated expression of stat3 2-fold (*p < 0.02) and yap1 1.6-fold (**p < 0.002) compared with wild-type animals. Expression of all genes was significantly upregulated in MTZ-treated Tg(rho:ntr-YFP)gmc500 fish compared with both wild-type and cep290 fish. Welch's ANOVA with Dunnett T3 multiple comparisons test; *p < 0.02, **p < 0.002, ***p < 0.0002, ****p < 0.0001. E, UMAP plot showing all cells obtained from sequencing with cells colored by sample. F, UMAP plot showing identified cell types from sequencing data, including bipolar cells (BP), amacrine cells (AC), horizontal cells (HC), retinal ganglion cells (RGC), vascular/endothelial cells (V/E), pericytes (PC), microglia (MiG), and retinal pigment epithelium (RPE). G, Violin plots showing expression of notch3, stat3, and yap1 in MG between sample groups. See Extended Data Tables 3-1, 3-2, 3-3, 3-4 for complete sequencing data.