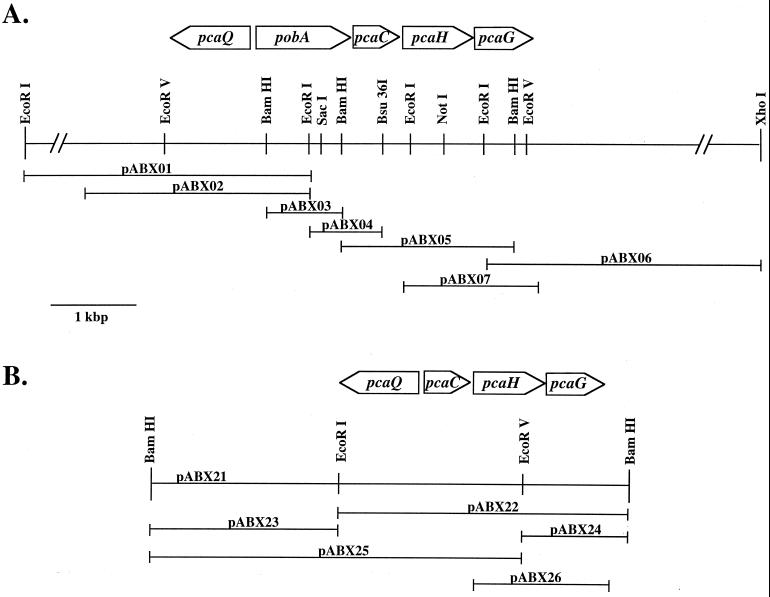
FIG. 2.
Restriction map of the chromosomal pca regions from S. stellata E-37 (A) and Y3F (B). The locations of genes and their transcriptional directions are shown relative to selected restriction endonuclease recognition sites. Horizontal lines indicate the DNA regions contained on recombinant plasmids, whose designations are shown above the corresponding line.

