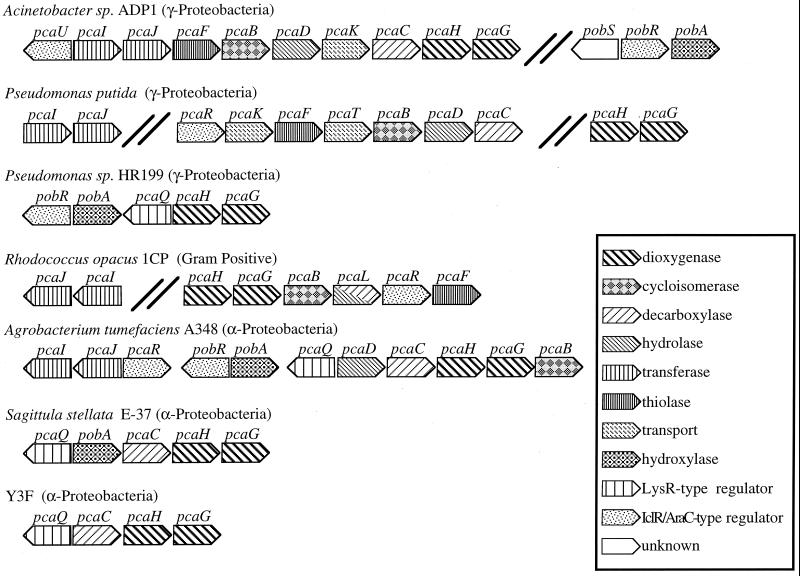
FIG. 5.
Organization of gene clusters for protocatechuate metabolism in selected bacteria. Arrows indicate the direction of transcription. Bold double lines indicate genes separated by <10 kbp. The information was compiled from the following sources: Acinetobacter strain ADP1 (12), P. putida (7, 9, 20, 39), Pseudomonas sp. strain HR199 (32), R. opacus 1CP (7), A. tumefaciens A348 (39), and S. stellata E-37 and isolate Y3F (this study).

