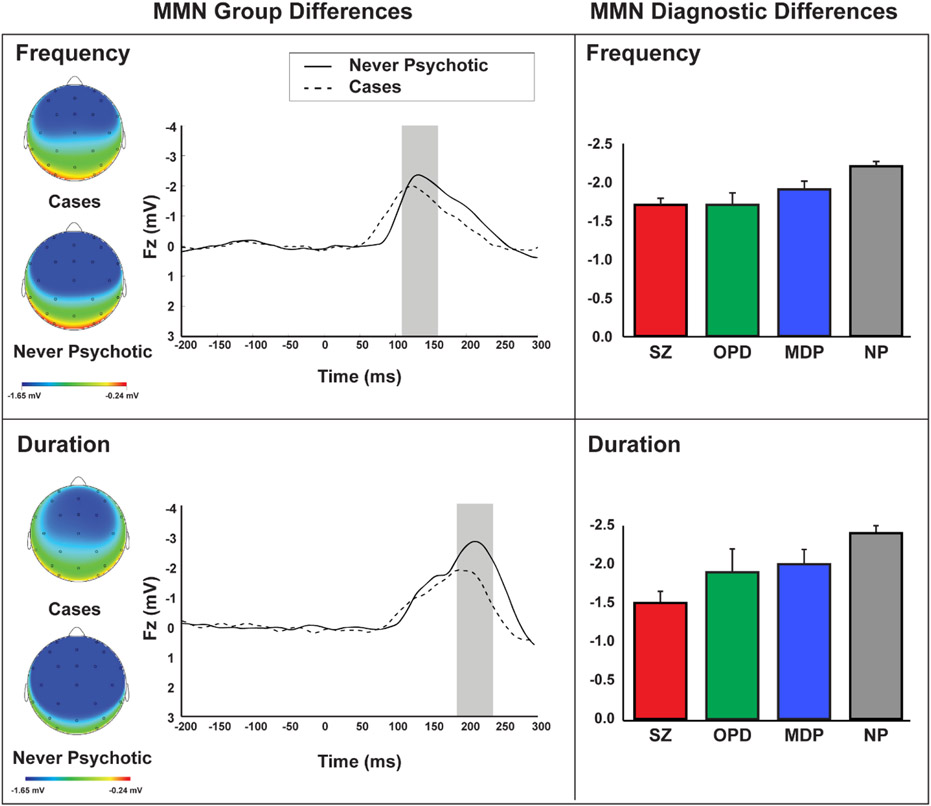
Figure 1.
In the top panel, scalp distributions and wave forms depict MMN amplitude in response to frequency deviants in cases vs. never psychotic groups (left) while bar graphs depict MMN amplitude for each diagnostic group: schizophrenia spectrum (SZ), mood disorder (MDP), other psychotic disorders (OPD), and never psychotic (NP). The bottom panel shows corresponding effects for MMN in response to duration deviants.

