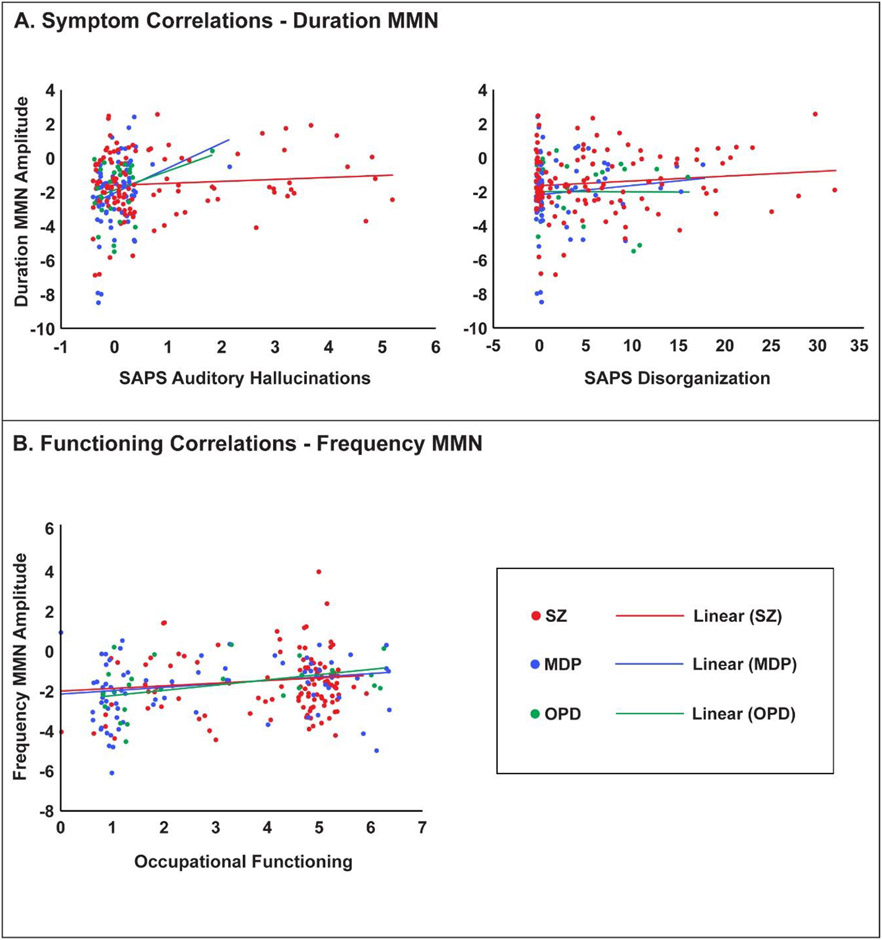
Figure 2.
(A) Correlations across cases (different colors for different diagnostic groups) between MMN-D and auditory hallucinations (left) and disorganization (right), in which higher scores represent increased frequency/severity. (B) Correlations between MMN-F and occupational functioning. A randomized jitter (−.4,4) was added to each ordinal value on the x-axis for display purposes in order to demonstrate overlapping data points.

