Figure 4. Modeling TUBA1A-V409I/A mutants in budding yeast reveals altered microtubule dynamics.
(A) Sequence alignment of human, mouse, and rat TUBA1A and budding yeast α-tubulins Tub1 and Tub3. Valine 409 is highlighted in yellow and resides in a highly conserved helix known as H11’. (B) Representative image of budding yeast cell with microtubule plus end binding protein Bik1 labeled with 3GFP. Scale bar = 1 µm. (C) Life plot of the dynamics of individual microtubules from wild-type (WT) (gray) and V410A (blue) cells showing the change in length over time. (D) Polymerization rates of astral microtubules. Images were obtained from three independent experiments; n=19 cells for WT, n=25 for V410I, n=19 for V409A. Each dot represents a single polymerization event. Bars are mean ± 95% confidence interval. Statistical analysis was done using a one-way ANOVA followed by a Tukey test to correct for multiple comparison tests. All statistics with p≤0.05 are indicated on graph. (E) Depolymerization rates of astral microtubules. Each dot represents a single depolymerization event. (F) Catastrophe frequency for astral microtubules expressed as the number of catastrophe events that occur per minute. Each dot represents the average catastrophe frequency of a single cell. (G) Histogram of all astral microtubule lengths from time lapse imaging of WT, V410I, and V410A cells. (H) Proportion of cells with astral microtubules after indicated time at 4°C. Symbols represent average of three independent experiments; for WT n=581 cells at 0 min, n=385 at 15 min, n=362 at 30 min, n=365 at 60 min, n=283 at 120 min; for V409I n=574 cells at 0 min, n=502 at 15 min, n=235 at 30 min, n=383 at 60 min, n=484 at 120 min; for V409A n=677 cells at 0 min, n=401 at 15 min, n=257 at 30 min, n=247 at 60 min, n=238 at 120 min. (I) Dynamicity of astral microtubules calculated as the total change in length divided by the total change in time. Each dot represents the calculated dynamicity value of a single cell. Bars are mean ± 95% confidence interval. Statistical analysis was done using a one-way ANOVA followed by a Tukey test to correct for multiple comparison tests. All statistics with p≤0.05 are indicated on graph.

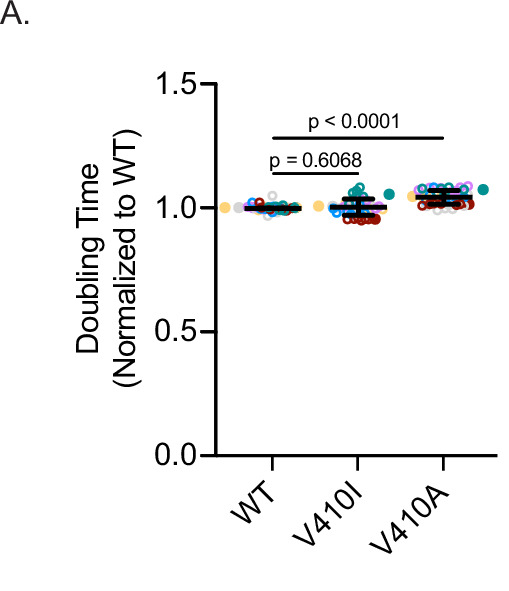
Figure 4—figure supplement 1. Fitness assay for V410I/A yeast mutants.