. 2022 Jun 7;11:e78840. doi: 10.7554/eLife.78840

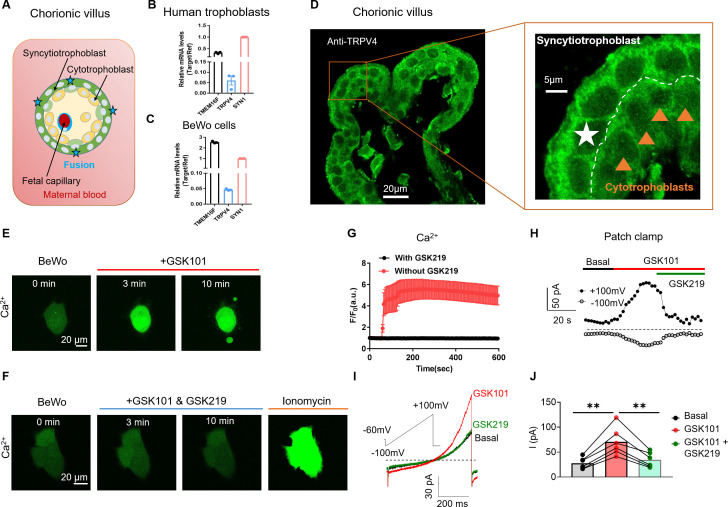
Figure 1. TRPV4 is functionally expressed in human trophoblasts.

(A) Schematic of the first trimester placental villus and trophoblast fusion. (B, C) qRT-PCR of TRPV4 in primary human trophoblasts (B) and BeWo cells (C). All genes were normalized to GAPDH and then normalized to Syncytin-1 (SYN1) (n=3). (D) Representative immunofluorescence of TRPV4 (green) and nuclei (blue) in a human first trimester placenta villus (cross-section). TRPV4 is expressed in both cytotrophoblasts and syncytiotrophoblasts. (E) GSK1016790A (GSK101, 20 nM), a specific TRPV4 agonist, triggers robust intracellular Ca2+ elevation in BeWo cells. (F) GSK2193874 (GSK219, 500 nM), a selective TRPV4 antagonist, abolishes GSK101-induced Ca2+ influx through TRPV4 channels in BeWo cells. Ca2+ elevation through ionomycin is intact in the presence of GSK219. All fluorescence images in (D–F) are the representatives of at least three biological replicates. (G) Summary of GSK101 (n=4) and GSK219 (n=5) effects on BeWo cell Ca2+ dynamics measured by Ca2+ dye (Calbryte 520). (H) Time course of outside-out currents elicited in response to 30 nM GSK101 with and without 500 nM GSK219. Current was elicited by a 500-ms ramp voltage protocol from –100 to +100 mV. The holding potential was set at –60 mV. (I) Representative current traces in the presence of GSK101 and GSK219+GSK101 from (H). (J) Quantification of GSK101-induced current in BeWo cells using the same voltage protocol in (H). Values represent mean  ± SEM and statistics were done using Student’s t-test (n=5 for each group, **: p<0.01).

Figure 1—source data 1. This data is from the Human Protein Atlas V20.1.proteinatlas.org.V20.1.proteinatlas.org.

Figure 1.

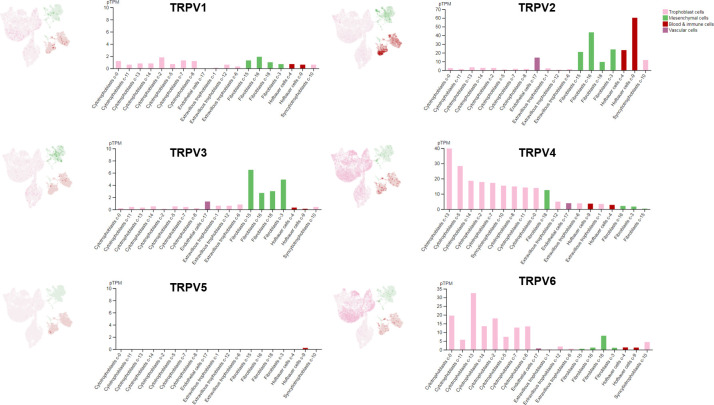
Figure 1—figure supplement 1. Single-cell RNA sequencing results of TRPV channel genes in different cell types from human placentas.

Figure 1—figure supplement 1.

UMAP plots (left) illustrate single-cell RNA expression profiles in different cell types, and bar graphs (right) show pTPM levels in each single cells cluster. All the data were from the Human Protein Atlas V20.1. proteinatlas.org.
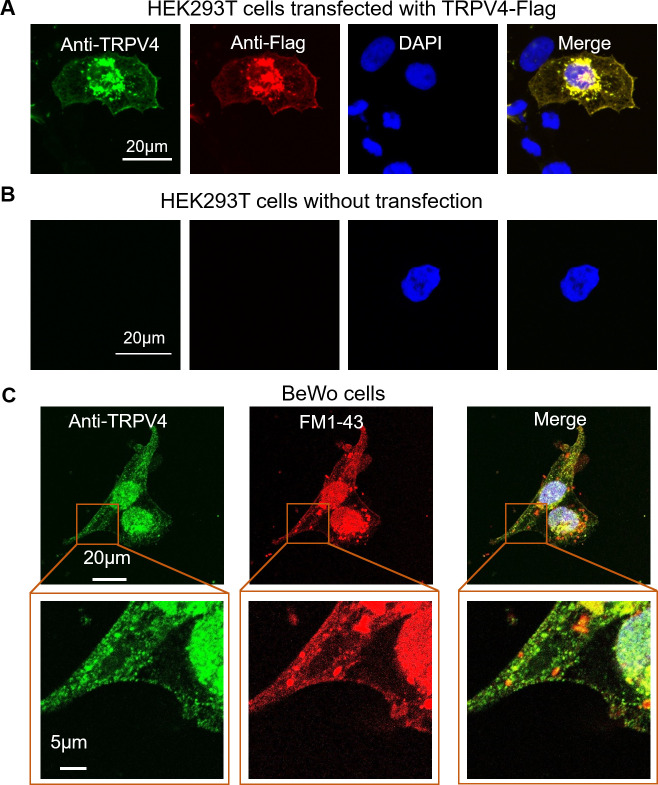
Figure 1—figure supplement 2. Validation of the TRPV4 antibody for immunofluorescence.

Figure 1—figure supplement 2.

(A, B) Validation of the TRPV4 antibody in HEK293T cells heterologously expressing a Flag-tagged TRPV4 plasmid. Immunofluorescence of TRPV4 (anti-TRPV4, green) and Flag tag (anti-Flag, red) in HEK293T cells transfected with a Flag-tagged TRPV4 plasmid (A) and non-transfected control (B). DAPI-stained nuclei are shown in blue. (C) Representative immunofluorescence of TRPV4 (green) in BeWo cells. The nuclei were stained with Hoechst (blue) and a plasma membrane marker, FM1-43 dye, is shown in red. All fluorescence images are the representatives of at least three biological replicates.
Figure 1—figure supplement 3. 4α-phorbol-12, 13-didecanoate (4α-PDD, 20 μM), a TRPV4 agonist, triggers intracellular Ca2+ elevation in BeWo cells.

Figure 1—figure supplement 3.

(A) Ca2+ dye (Calbryte 520, green) was used to monitor the dynamics of intracellular Ca2+. All fluorescence images are the representatives of at least three biological replicates. (B) Time course of 4α-PDD triggered Ca2+ influx in BeWo cells (n=7).
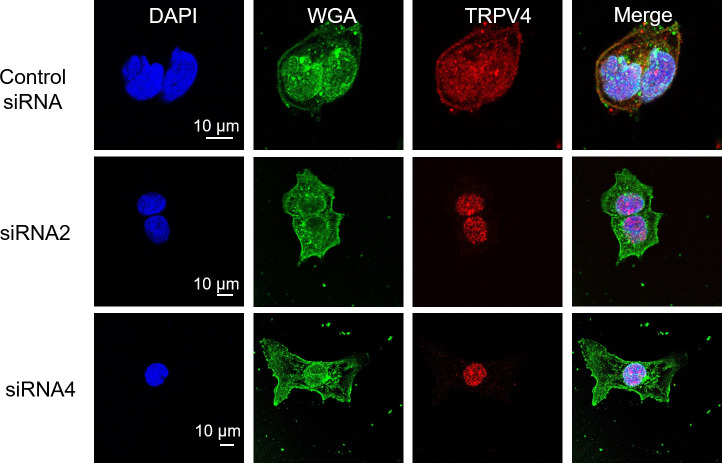
Figure 1—figure supplement 4. Immunofluorescence of TRPV4 in BeWo cells transfected with TRPV4 siRNAs.

Figure 1—figure supplement 4.

Representative immunofluorescence of TRPV4 (red) in scrambled control siRNA and TRPV4 siRNA knockdown BeWo cells. The nuclei were stained with Hoechst (blue). The plasma membrane was labeled with WGA dye (green). All fluorescence images are the representatives of at least three biological replicates.
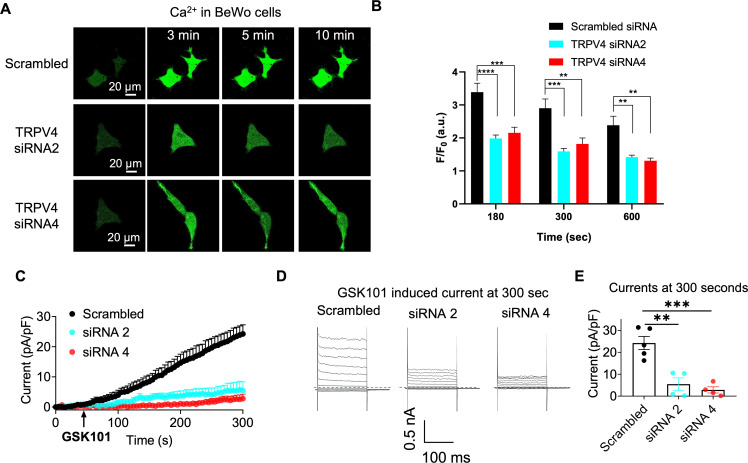
Figure 1—figure supplement 5. siRNA knockdown supports TRPV4 functional expression in BeWo cells.

Figure 1—figure supplement 5.

(A) Representative Ca2+ imaging in BeWo cells transfected with scrambled siRNA and TRPV4 siRNAs. Calbryte 590 was used to monitor cytosolic Ca2+ dynamics. All fluorescence images are the representatives of at least three biological replicates. (B) Quantification of GSK101-induced Ca2+ influx in BeWo cells transfected with scrambled siRNA (n=50), TRPV4 siRNA2 (n=55), or siRNA4 (n=51) from at least three biological replicates. Values represent mean ± SEM and statistics were done using two-way ANOVA followed by Tukey’s test (**: p<0.01, ***: p<0.001, and ****: p<0.0001). (C) Time course of 30 nM GSK101-induced currents from scrambled siRNA and TRPV4 siRNAs transfected BeWo cells. Whole-cell current was elicited by a ramp protocol from –100 to +100 mV every 5 s and is plotted at +100 mV. Error bar represents SEM. n=4–5. (D) Representative GSK101-induced currents at 300 s after GSK101 stimulation in (C). Whole-cell current was elicited by a voltage step protocol (200 ms) from –100 to +140 mV. (E) Currents densities at +140 mV after 300 s after GSK101 application. Current densities from BeWo cells treated with scrambled siRNA, TRPV4-siRNA2 and TRPV4-siRNA4 were 24.24±3.02, 5.47±2.86, and 24.24±3.02 pA/pF, respectively. Values represent mean ± SEM and statistics were done using one-way ANOVA followed by Tukey’s test (**: p<0.01 and ***: p<0.001, n=4–5).