. 2022 Jun 7;11:e78840. doi: 10.7554/eLife.78840

Figure 3. TRPV4 activation elicits TMEM16F current in BeWo cells.

(A, B) Time course of whole-cell currents in response to 30 nM GSK101 stimulation in WT and TMEM16F-KO BeWo cells. The currents were elicited with the ramp protocol shown in (B) (top). (A) The current amplitudes at +100 mV were plotted every 5 s. (B) Representative currents at three different time points as shown in (A). (C) Representative current traces elicited by a voltage step protocol (200 ms) from –100 to +140 mV at three different time points t1, t2, and t3 as indicated in (A). (D) Statistical analysis of current density (+100 mV) at t3 in WT and TMEM16F-KO BeWo cells. The current was elicited by the voltage steps shown in (C). Values represent mean ± SEM and statistics were done using Student’s t-test (n=5 for each group, **: p<0.01). (E) Statistical analysis of amplification ratio (current amplitude ratio at t3 and t2 in (C)) in WT and TMEM16F-KO BeWo cells. Values represent mean ± SEM and statistics were done using Student’s t-test (n=5 for each group, ****: p<0.0001). WT, wild-type.

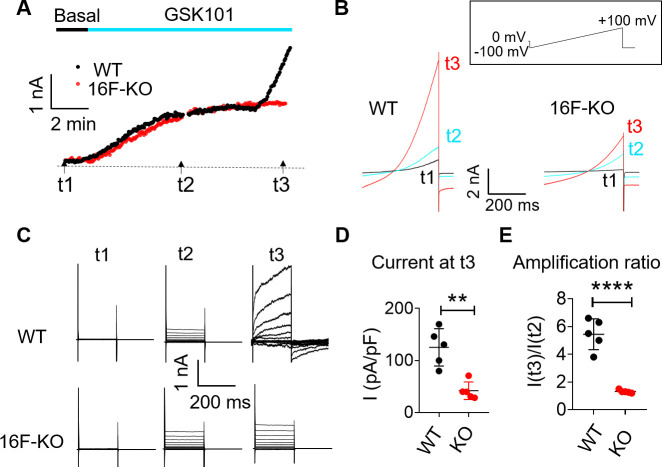
Figure 3—source data 1. Source data for Figure 3 and Figure 3—figure supplement 1B,C,E,F.

Figure 3.

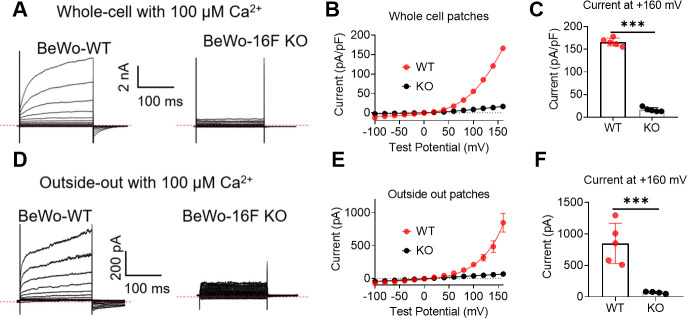
Figure 3—figure supplement 1. Ca2+-activated current in BeWo WT and TMEM16F KO BeWo cells.

Figure 3—figure supplement 1.

(A) Representative whole cell recordings elicited by a voltage step protocol (200 ms) from –100 to +140 mV. The currents were recorded at ~7–10 min after whole-cell patches were formed. The free Ca2+ inside the pipette was 100 µM. (B) I-V relation of current recorded in WT and TMEM16F-KO BeWo cells under whole cell configuration. (C) Peak whole-cell current at +160 mV was compared with Student’s t-test (***p<0.001, n=5). (D) Representative outside-out patch recordings elicited by a voltage step protocol (200 ms) from –100 to +140 mV. The currents were recorded immediately after outside-out patches were formed. The free Ca2+ inside the pipette was 100 µM. (E) I-V relation of current recorded in WT and TMEM16F-KO BeWo cells under outside-out configuration. (F) Peak outside-out current at +160 mV was compared with Student’s t-test (***p<0.001, n=5 for WT and n=4 for TMEM16F-KO). WT, wild-type.
Figure 3—figure supplement 2. Simultaneous monitoring of GSK101-triggered channel and lipid scramblase activities in BeWo cells.

Figure 3—figure supplement 2.

(A) Time course of 30 nM GSK101-induced current and PS exposure recorded using patch clamp-lipid scramblase fluorometry. (B) Representative data of PS exposure (top) and current traces (bottom) at different time points as indicated in (A). t1 was during baseline recording. t2 demarcates the time point right before the time-dependent, outward rectifying TMEM16F current started to develop. t3 was 10 min after GSK101 application. Current and AnV signal were both normalized to their maximum values at t3. n=4. AnV, Annexin V.