
Figure 5. TRPV4 and TMEM16F are functionally coupled within microdomain in BeWo cells.
(A) Outside-out patch configuration and voltage protocols used to demonstrate TRPV4-TMEM16F coupling. The holding potential was set at –60 mV. (A) –100 mV pre-pulse with varied length from 0.1 to 1 s with 0.1-s increment was applied along with perfusion of 30 nM GSK101 to induce Ca2+ influx. Following the pre-pulse, a depolarized pulse with 0.2 s duration and 140 mV amplitude was applied to record TMEM16F current. (B) Left: Representative outside-out patch recordings from wild-type (WT) BeWo cells under different conditions: (1) intracellular 0.2 mM EGTA, extracellular 0 Ca2+ with 30 nM GSK101 (n=5); (2) intracellular 0.2 mM EGTA, extracellular 2.5 mM Ca2+ with 30 nM GSK101 (n=6); (3) intracellular 2 mM EGTA, extracellular 2.5 mM Ca2+ with 30 nM GSK101 (n=9); (4) intracellular 2 mM BAPTA, extracellular 2.5 mM Ca2+ with 30 nM GSK101 (n=7); and (5) Intracellular 0.2 mM EGTA, extracellular 2.5 mM Ca2+ with 30 nM GSK101 for TMEM16F-KO BeWo cells (n=6). Right: Diagrams demonstrating TRPV4-TMEM16F coupling under each condition on the left. The intensity of green color depicts Ca2+ chelating capacity and kinetics with BAPTA as the most efficient Ca2+ chalator. (C, D) Quantification of peak current amplitudes at +140 mV after 0.1 s pre-pulse (C) and 1 s pre-pulse (D). Values represent mean ± SEM and statistics were done using Student’s t-test (****: p<0.0001, **: p<0.01, *: p<0.05, ns: not significant).
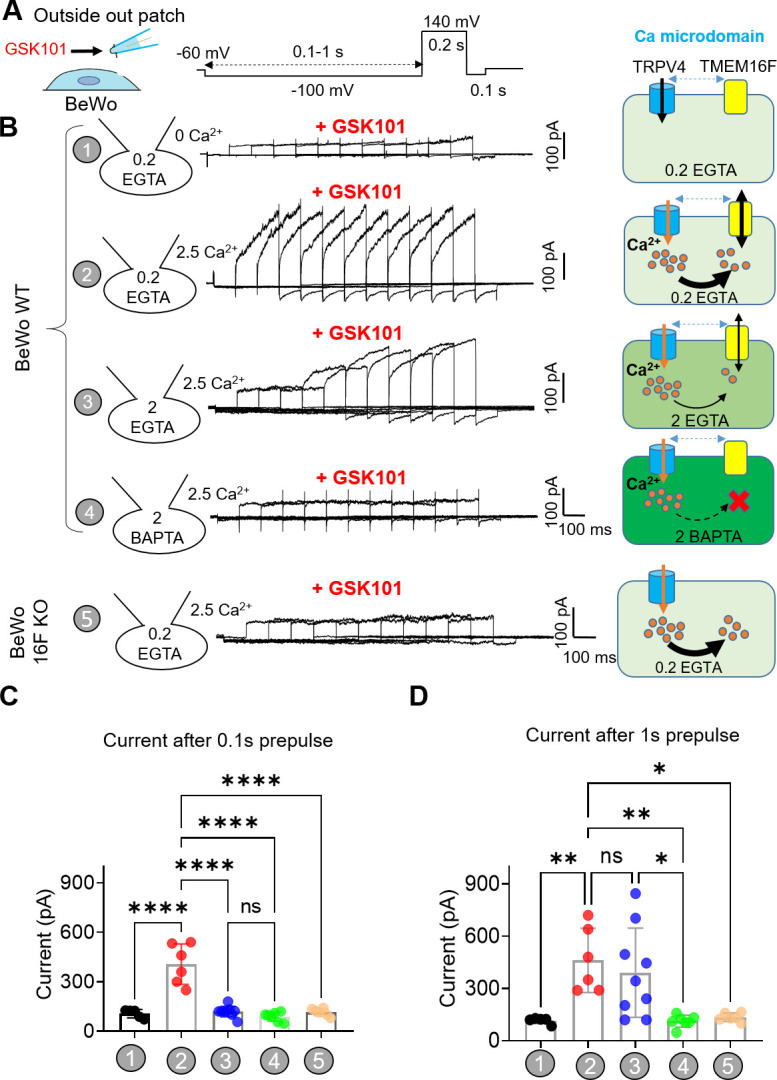
Figure 5—figure supplement 1. Lack of TRPV4-TMEM16F coupling in BeWo trophoblast cells in the absence of GSK101.
