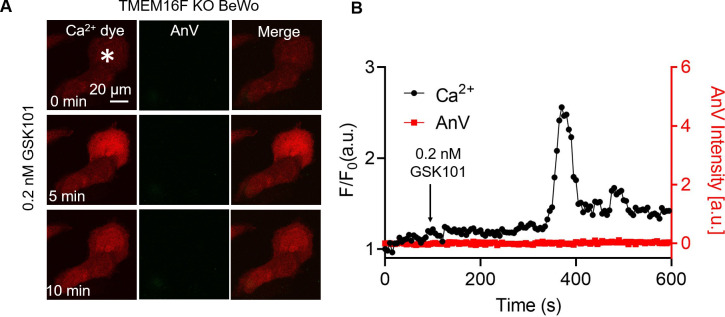
Figure 6. Transient Ca2+ influx through TRPV4 induces local PS exposure in BeWo cells.
(A) Representative images of Ca2+ and PS exposure from the BeWo cells stimulated with low concentration of GSK101 (0.2 nM). Ca2+ dye (Calbryte 594) and fluorescently tagged AnV proteins (AnV-CF488) were used to measure the dynamics of intracellular Ca2+ and PS externalization, respectively. The white box highlights transient and reversible PS exposure in a membrane process in response to TRPV4 stimulation. The arrow heads label the PS positive debris in the cell culture, which existed before TRPV4 stimulation. All fluorescence images are the representatives of at least three biological replicates. (B) The dynamics of global Ca2+ (black) and local AnV signal (red) upon 0.2 nM GSK101 stimulation in WT BeWo cells. (C) Quantification of WT (7/18) and TMEM16F KO (0/21) BeWo cells that showed local PS exposure in response to 0.2 nM GSK101. AnV, Annexin V; WT, wild-type.


