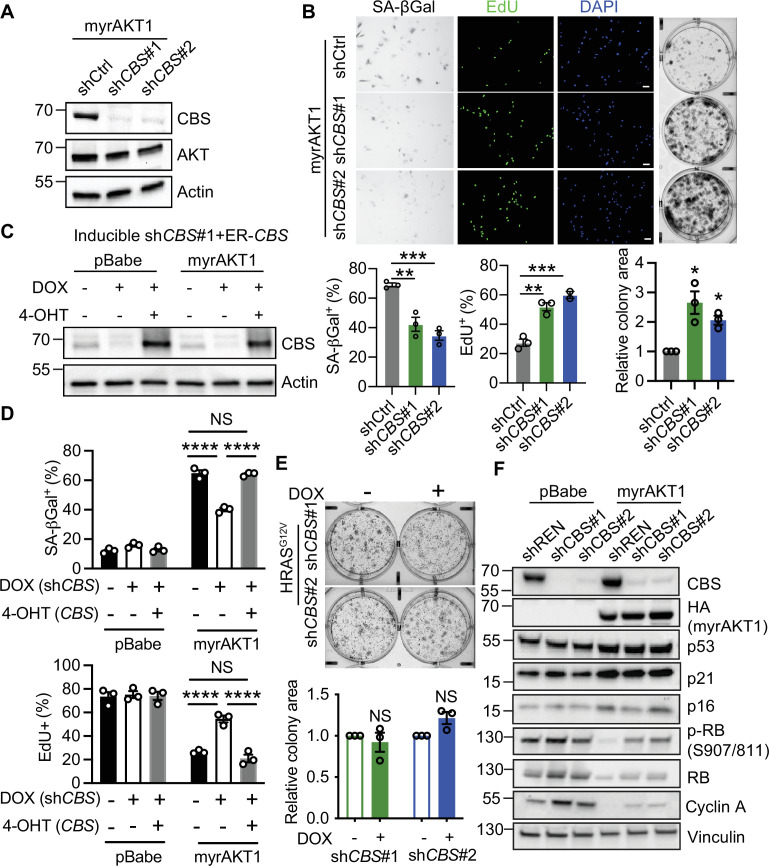
Figure 2. Depletion of cystathionine-β-synthase (CBS) promotes escape from AKT-induced senescence.
(A and B) BJ3 human skin fibroblasts expressing telomerase reverse transcriptase (BJ-TERT) cells expressing myrAKT1 were transduced with pGIPZ-shCBS or non-silencing small hairpin RNA (shRNA) control (shCtrl) on day 6 post-transduction of myrAKT1. (A) Western blot analysis was performed on day 8 post-transduction of shRNA. Representative of n=2 experiments. (B) Images and quantification of the percentage of cells with positive staining for SA-βGal activity and EdU incorporation on day 8 post-transduction of shRNA, as well as colony formation assay on day 14 post-transduction of shRNA. Data is presented as mean ± SEM (n=3). One-way analysis of variance (ANOVA) with Holm-Šídák’s multiple comparisons was performed (**p<0.01; ***p<0.001). Relative colony area normalized to shCtrl group is presented as mean ± SEM (n=3) and one sample t-test compared to the hypothetical value 1.0 was performed (C–D) BJ-TERT cells expressing doxycycline-inducible CBS shRNA#1 and 4-OHT-inducible CBS were transduced with pBabe or myrAKT1, treated with ±doxycycline (1 μg/ml)±4 OHT (20 nM) on day 5 post-transduction and analyzed on day 14 post-transduction. (C) Western blot analysis of CBS expression. Actin was probed as a loading control. (D) The percentage of cells with positive staining for SA-βGal activity or EdU proliferation marker incorporation is presented as mean ± SEM (n=3). Two-way ANOVA with Holm-Šídák’s multiple comparisons was performed (NS, not significant; ****p<0.0001). (E) BJ-TERT cells expressing doxycycline-inducible CBS shRNA were transduced with HRASG12V, treated with doxycycline (1 μg/ml) on day 5 post-transduction and colony formation assay analyzed on day 14 post-transduction. Relative colony area normalized to doxycycline-untreated group is presented as mean ± SEM (n=3) and one-sample t-test compared to the hypothetical value 1.0 was performed (NS, not significant). (F) BJ-TERT cells expressing doxycycline-inducible shCBS or control shREN were transduced with pBabe or myrAKT1 and then treated with doxycycline (1 μg/ml) on day 5 post-transduction. Western blot analysis was performed on day 14 post-transduction. Vinculin was probed as a loading control. Representative of n=2–4 experiments.


