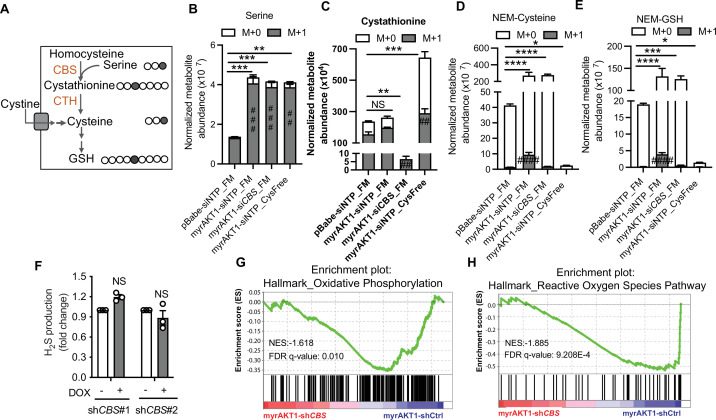
Figure 3. Depletion of cystathionine-β-synthase (CBS) in AKT-induced senescence (AIS) cells does not affect cysteine and glutathione (GSH) abundance in cysteine-replete conditions.
(A) Schematic of [3–13C] serine isotope tracing. Gray circles indicate 13C carbon atoms. Clear circles indicate unlabeled carbon atoms. (B–E) BJ3 human skin fibroblasts expressing telomerase reverse transcriptase (BJ-TERT) cells were transduced with pBabe or myrAKT1. After 6 days cells were transfected with either CBS siRNA (siCBS) or control siRNA (siOTP). On day 3 post-siRNA transfection, cells were cultured in either full medium (FM) or cysteine-deficient medium (Cys-Free) for 48 hr. Six hours before harvest, the culture medium was replaced with the basal isotope labeling medium containing 400 μM [3–13C] serine. The thiol redox metabolome was assessed by targeted liquid chromatography mass spectrometry (LC/MS). The abundances of labeled and unlabeled metabolites including (B) serine, (C) cystathionine, (D) NEM-Cys, and (E) NEM-GSH normalized with cell number are presented as mean ± SEM (n=4). Statistical significance was determined by one-way analysis of variance (ANOVA) with Holm-Šídák’s multiple comparisons (for the total metabolite levels, *p<0.05; **p<0.01; ***p<0.001; ****p<0.0001; and for the M+1 metabolite levels, ##p<0.01; ###p<0.001; ####p<0.0001 compared to pBabe-siNTP_FM cells). (F) BJ-TERT cells expressing doxycycline-inducible shCBS were transduced with myrAKT1, and treated with doxycycline (1 μg/ml) on day 5 post-transduction. Hydrogen sulfide (H2S) production was measured by AzMC on day 14 post-transduction. Fold changes over doxycycline-untreated group are presented as mean ± SEM (n=3). One sample t-test compared to the hypothetical value 1.0 was performed (NS, not significant). (G and H) Gene set enrichment analysis of RNA-seq data showing downregulation of hallmark of oxidative phosphorylation and reactive oxygen species pathways in myrAKT1-shCBS cells compared with myrAKT1-shCtrl cells.


