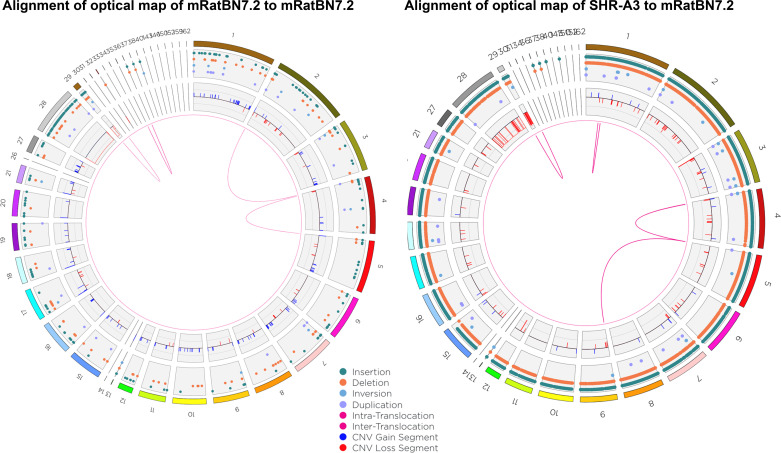
Figure 2.
Circos plot in which the optical map of mRatBN7.2 produced in the VGP is aligned to the in silico map of mRatBN7.2 assembly (left), and alignment of SHR-A3 optical map to the in silico map of mRatBN7.2 (right). Both alignments show much greater concordance. As expected, small-scale variations (insertions and deletions) are more notable in the SHR-A3/mRatBN7.2 comparison, whereas larger-scale structural variations are markedly reduced in both alignments. VGP, Vertebrate Genomes Project.

