Figure 4.

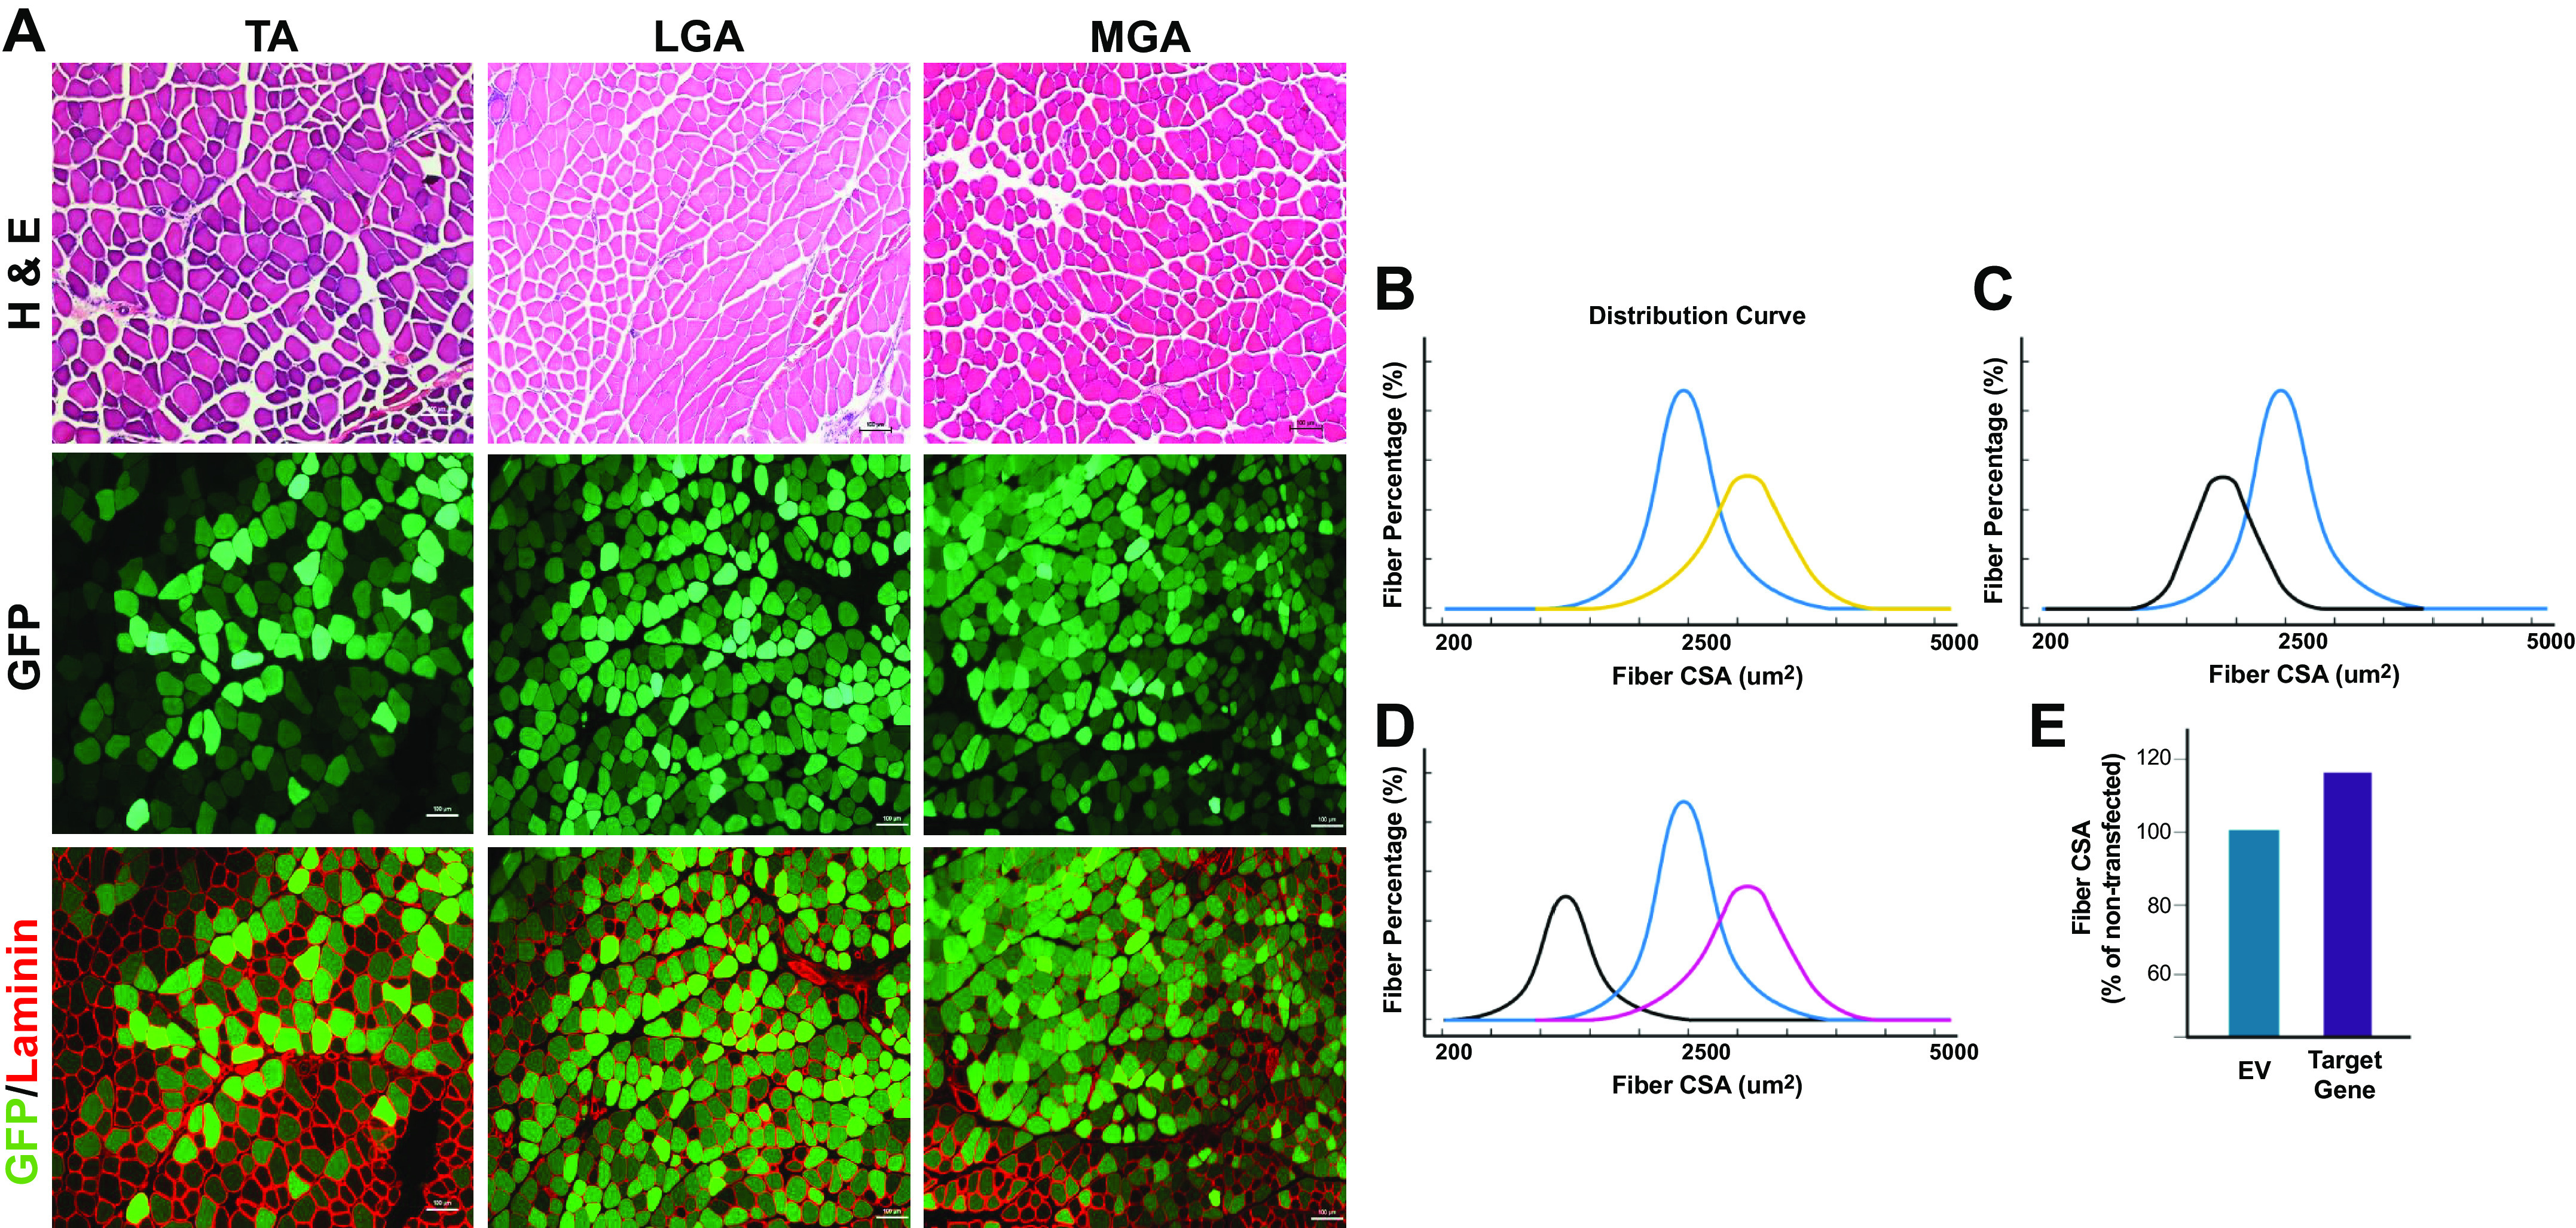
Identification and quantification of transfected skeletal muscle fibers in various hindlimb muscles. A: representative images of hindlimb skeletal muscles from 12- to 16-wk-old C57/BL6 male mice electroporated with an emerald GFP (emGFP) plasmid for 7 days. Separately, tibialis anterior (TA) and gastrocnemius (GA) muscles are given an intramuscular injection with 0.4 U/μL of hyaluronidase before electroporation. After 2 h, the TA and GA muscles are then injected with 2 µg and 5 µg of emGFP respectively and electrical pulses (175 V/cm, 10 pulses, 20 ms) are applied using two-paddle plate electrodes as detailed in published protocols (54, 67, 84). The TA and gastrocnemius muscles were stained for hematoxylin and eosin (H&E), and laminin using protocols detailed in Table 5. ×10 magnification, scale bar = 100 µm. In the analysis of transfected muscle fiber cross-sectional area (CSA), comparisons can be made between empty vector and gene of interest transfected fibers in unchallenged skeletal muscle to assess for hypertrophy (B; yellow line) and atrophy (C; black line). The blue line represents normal fiber CSA distribution of nontransfected or empty vector fibers in B and C. The nontransfected fibers can be assessed for fiber CSA to confirm that the plasmids are not impacting surrounding local muscle fibers. D: in transfected muscle fibers undergoing an additional intervention (e.g., denervation), fiber CSA comparisons between empty vector (black line), gene of interest (purple line), and nontransfected/innervated (blue line) fibers can be analyzed. E: an alternative strategy to incorporate nontransfected muscle fibers in the CSA quantification is to represent the fiber CSA as a percentage of the nontransfected fibers and compare the empty vector to the gene of interest expression plasmid, as used in previously published studies (57,58, 157). Created with Biorender.com.
