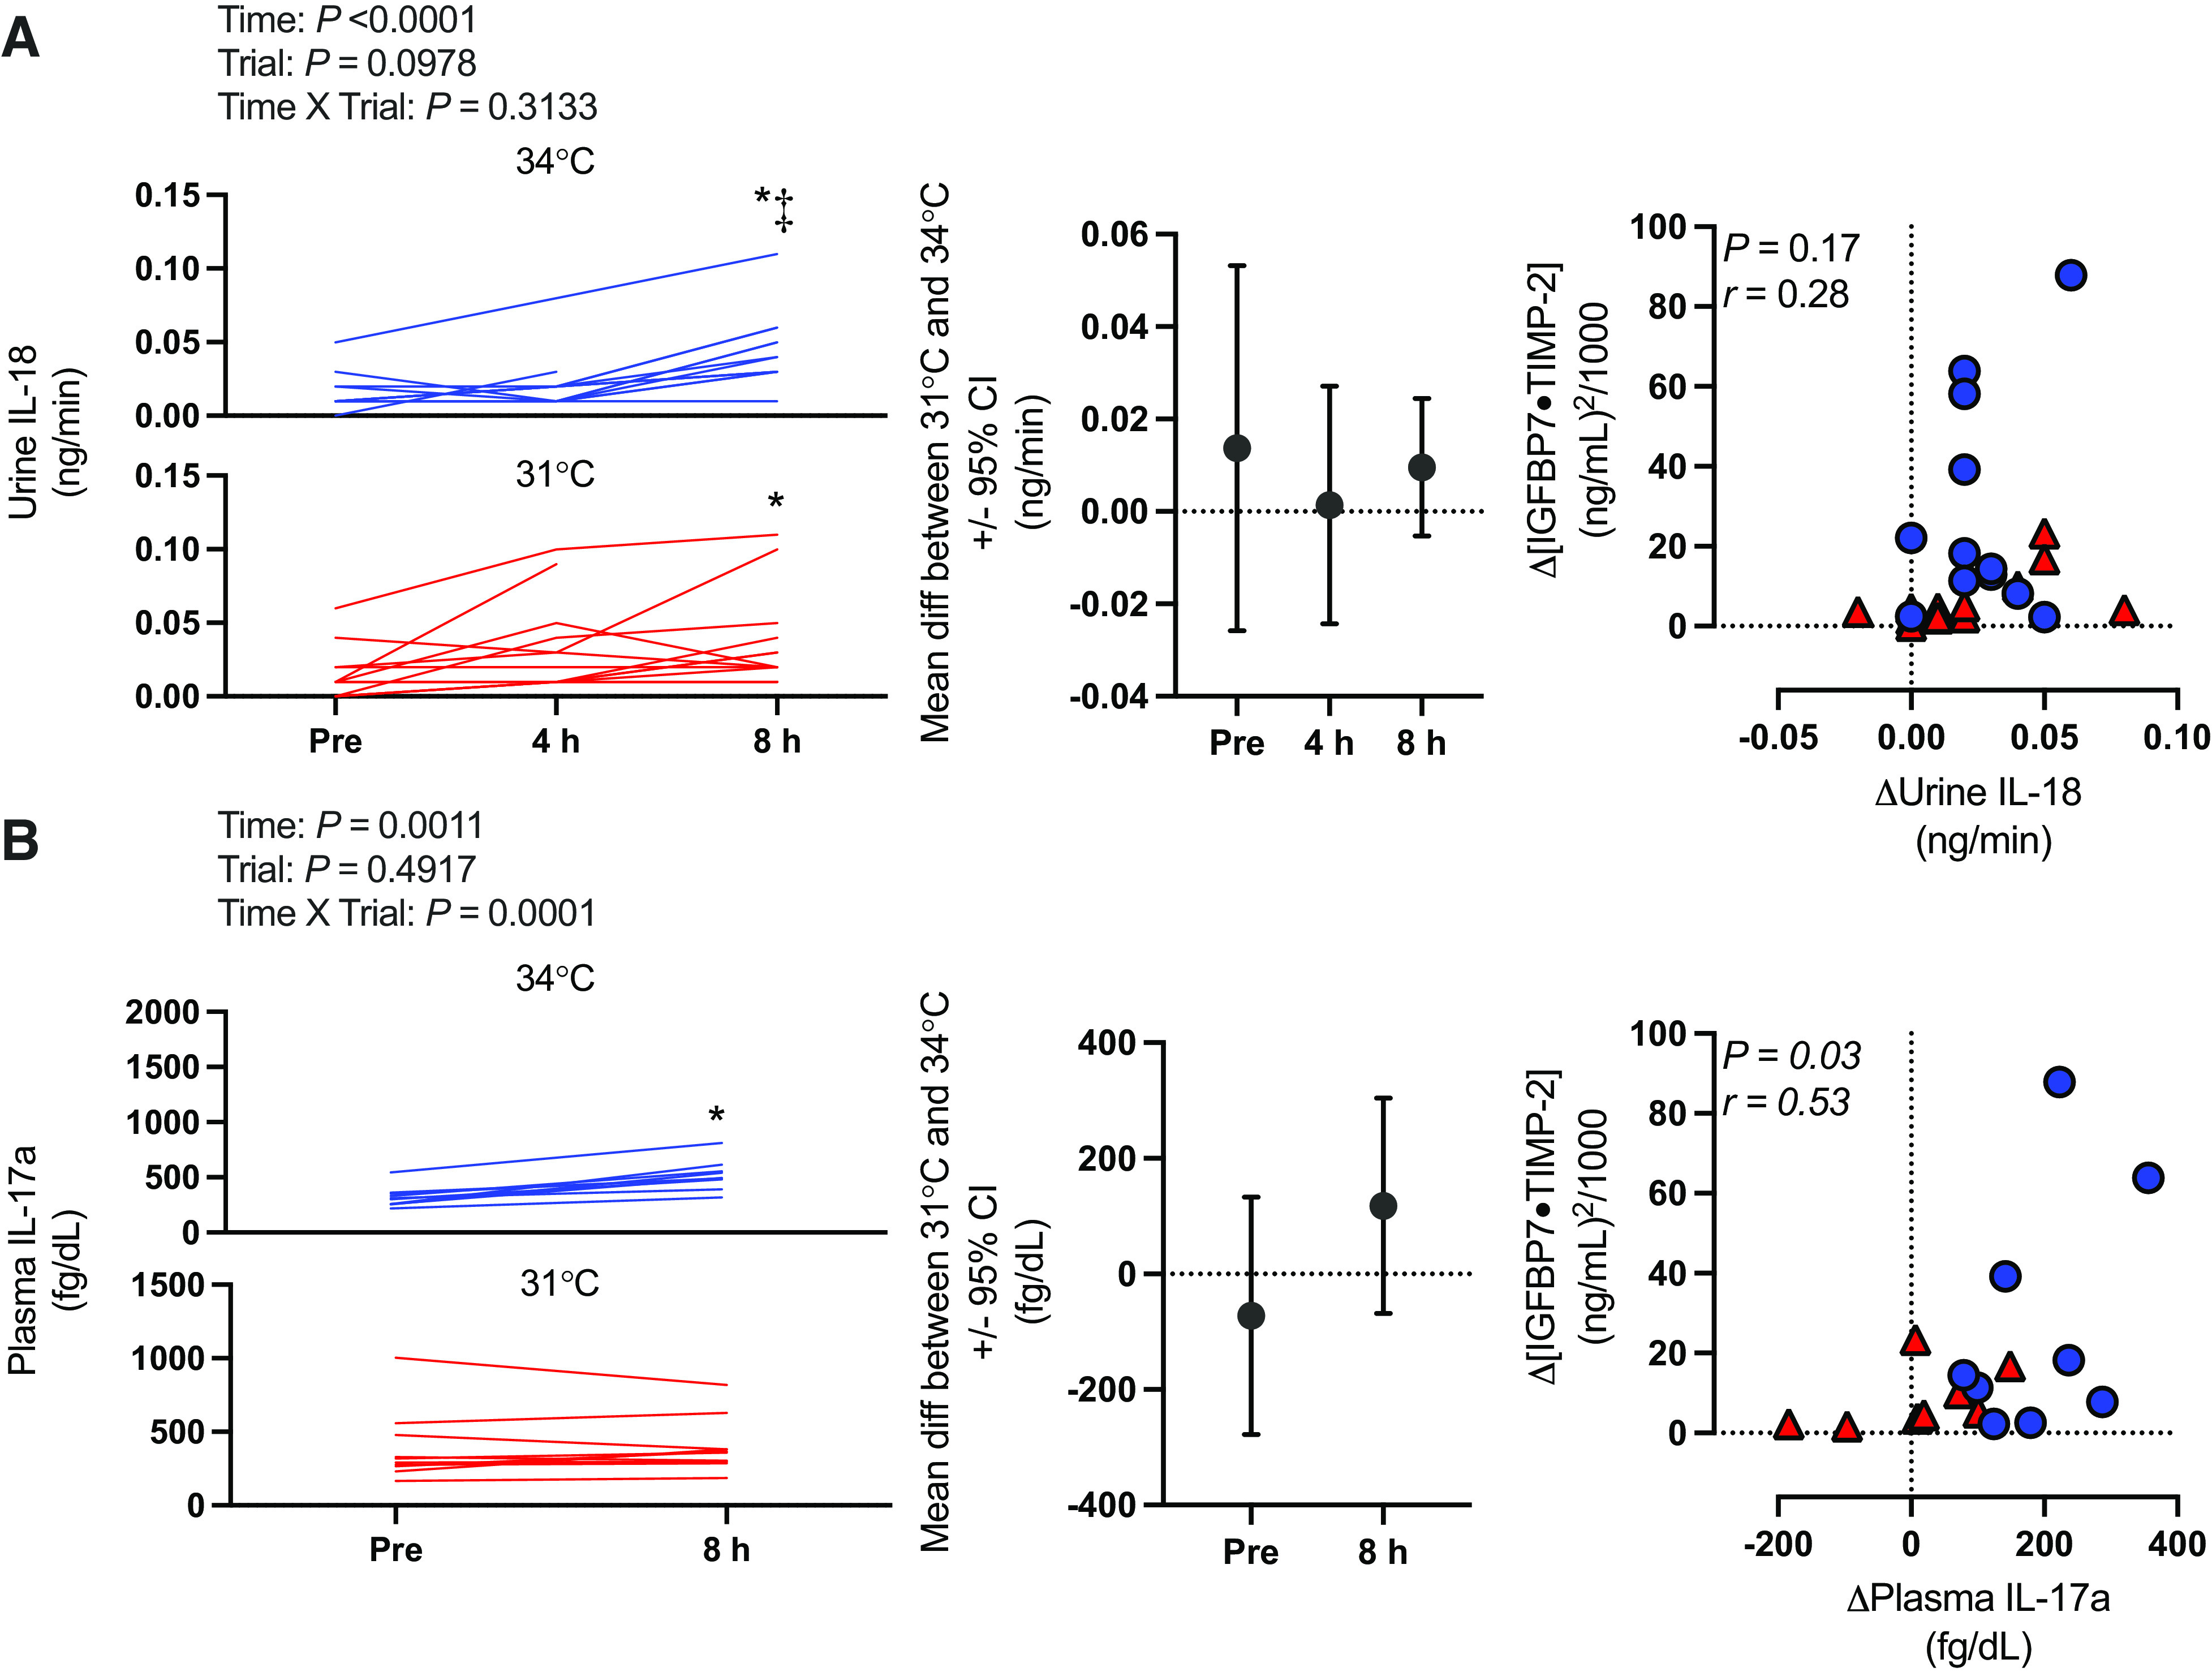
Figure. 5.

Etiological mechanisms of kidney injury: inflammatory markers. Left: absolute plasma and urinary biomarkers normalized to urine flow rate presented as individual values for the 34°C trial (blue lines) and the 31°C trial (red lines). Values are presented at preexposure (Pre), 4 h, and 8 h for urine interleukin 18 (IL-18) and at Pre and 8 h for plasma interleukin 17a (IL-17a). n for each variable and time point is reported within the text. y-Axes for each trial are different to enhance clarity. All statistical inference was completed after data were log transformed and analyzed with a repeated-measures linear mixed model (time × trial). The linear mixed model table is shown. If a significant interaction or main effect was found, post hoc multiple comparisons were completed with Šídák’s tests. Center: the mean difference between 31°C and 34°C ± 95% confidence interval (CI). Right: correlation between the change in biomarkers of inflammation and change kidney injury risk (i.e., [insulin-like growth factor-binding protein 7 (IGFBP7) · tissue inhibitor metalloproteinase 2 (TIMP-2)]). Data were analyzed (Pearson r) with both 34°C (blue circles) and 31°C (red triangles) combined, and exact P value and r value are shown. *Different from Pre (P < 0.05); ‡different from 4 h (P < 0.05).
