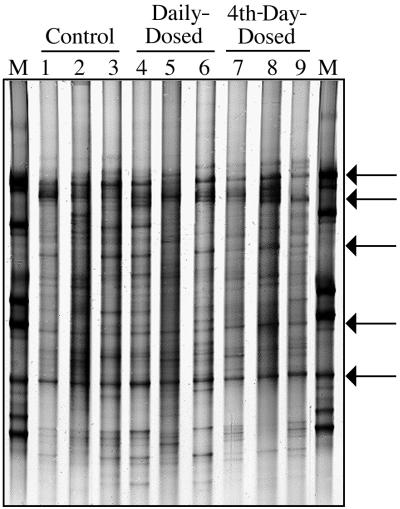
FIG. 2.
PCR-DGGE profile generated from fecal samples obtained from individual piglets on day 15 using primers specific for the V3-16S rDNA region showing diversity of banding patterns present in each animal. Bacterial standard marker lanes are denoted as M. Lanes 1 to 3 are from the control group, lanes 4 to 6 are from the daily-dosed piglet group, and lanes 7 to 9 are from the 4th-day-dosed piglet group. Arrows indicate bands which are common to most piglet fecal samples.

