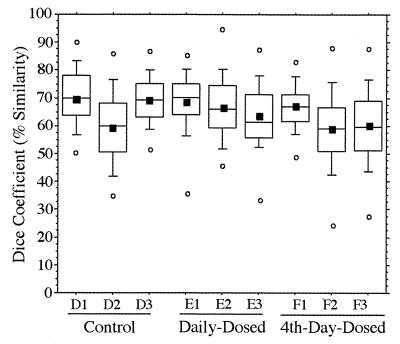
FIG. 4.
Tukey plots of V3-16S rDNA region similarity coefficients (n = 190 each) calculated within individuals for fecal samples collected daily from piglets in control, daily-dosed, and 4th-day-dosed groups. Means are indicated as solid squares; the 25th, 50th, and 75th percentile data are indicated as the bottom, middle, and top edges of the boxes, respectively; the 10th and 90th percentiles are indicated as whiskers; and the extreme data points are indicated as circles. Letter and number designations on the x axis refer to individual animal identification numbers.

