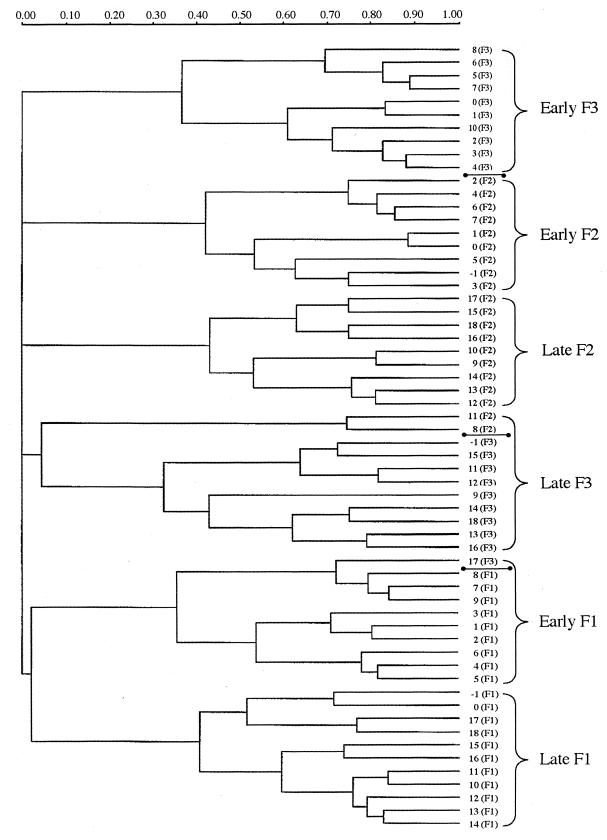
FIG. 5.
Dendrogram illustrating the correlation between animal-to-animal variation in V3-16S rDNA region banding patterns. The three piglets (F1, F2, and F3) represented are from the 4th-day-dosing group. Numbers indicate the sampling day with individual animal designations shown within parentheses. Marker bars (●——●) indicate divisions between individual piglet pattern groups. Brackets indicate the two major time period pattern separations (early and late) that occur within each animal's pattern group. Dendrogram distances are in arbitrary units.

