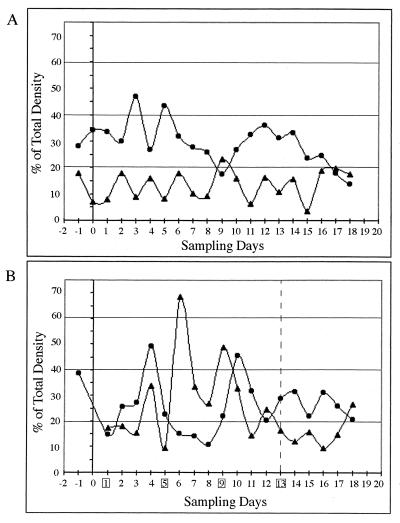
FIG. 9.
Comparison of intensities of V1-3 band (L. reuteri) (▴) with V1-6 band (Lactobacillus sp. (●) in a control animal (D2) showing a counteroscillation pattern over the duration of the experiment (A) and for a 4th-day-dosed piglet (F2) showing a dosage-altered pattern (B). For clarity only two of the six possible bands are included in panels (A) and (B). Dosing days for the 4th-day-dosed piglets are boxed, and the last dosing day is indicated by the broken line.

