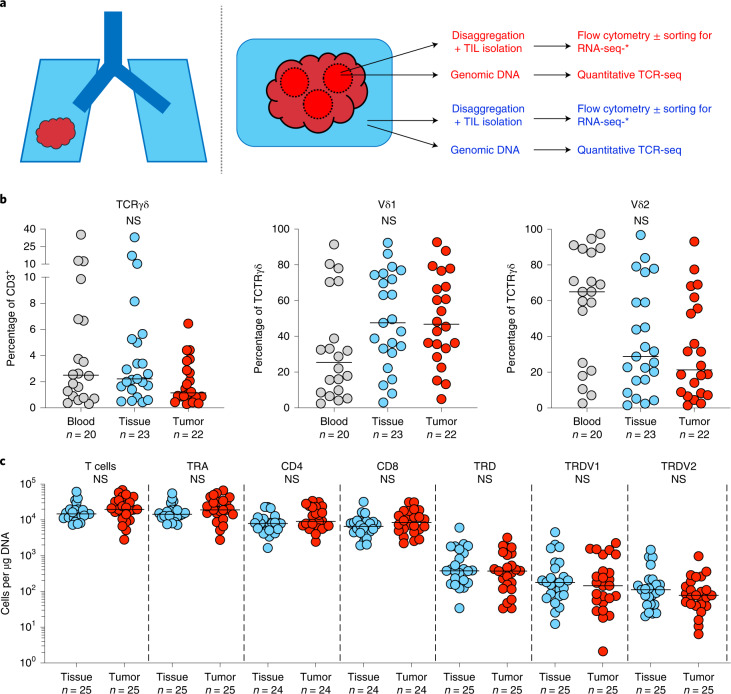
Fig. 1. Experimental design and γδ T cell composition in lung tissues and NSCLCs.
a, Overview of study design. Paired tumor regions (red) and NT lung tissues (blue) collected under the TRACERx Study were enzymatically digested to extract tissue/TILs. TILs were cryopreserved and thawed at a later date for flow cytometry ± RNA-seq. In parallel, gDNA was extracted from undigested matched tumor regions and NT lung tissues and sent for subsequent quantitative TCR-seq. In addition, PBMCs were isolated from contemporaneous blood draws and cryopreserved before subsequent thaw for flow cytometry. b, Percentage of CD3+ T cells staining for TCRγδ (left) and percentage of TCRγδ T cells staining for Vδ1 (middle) and Vδ2 (right) in PBMCs (blood), NT lung tissues (tissue) and tumors (tumor). Not all patients had paired samples. The bar represents the median. The Kruskal–Wallis test with post-hoc Dunn’s test corrected for multiple testing was used. c, Absolute counts of total T cells, αβ T cells (TRA), γδ T cells (TRD) and Vδ1 (TRDV1) and Vδ2 (TRDV2) T cells per microgram of DNA determined by TCR-seq. Absolute counts of CD4+ αβ T cells (CD4) and CD8+ αβ T cells (CD8) were determined by mapping the proportion of CD3+/TCRγδ− T cells staining for CD4 or CD8 in flow cytometry analysis of paired TILs. No significant differences were observed within demarcated T cell subsets between NT tissues and tumors. Samples with <1 cell μg−1 of DNA were not plotted for the purposes of visualization. The bar represents the median. A two-tailed Mann–Whitney U-test was used within demarcated T cell subsets. Significant P values are shown. NS, not significant. The n numbers and datapoints represent independent patients.

