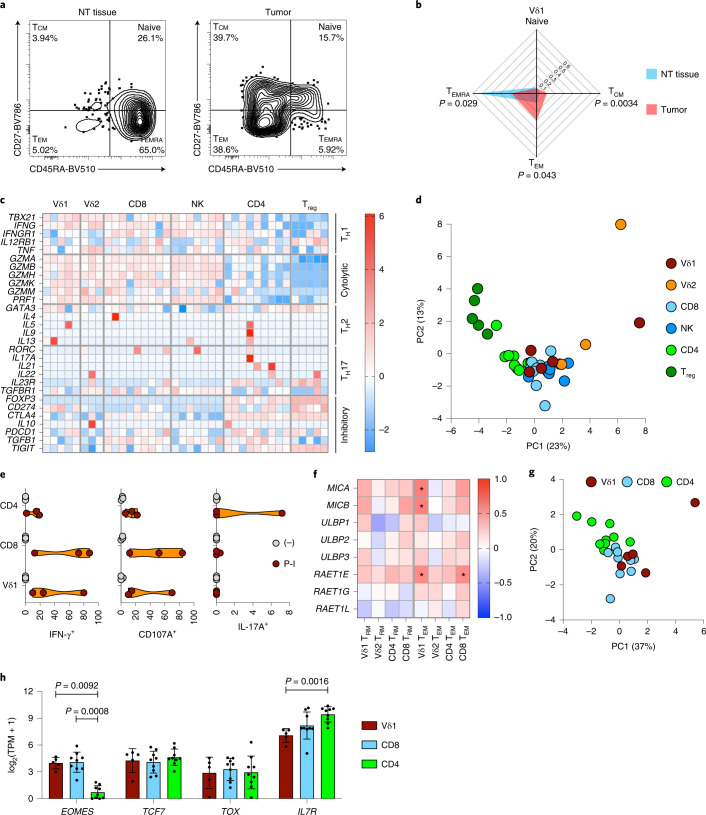
Fig. 3. Intratumoral Vδ1 T cells have a memory phenotype, are Tc1 skewed and demonstrate features of tissue residency and stemness.
a, Representative flow cytometry plots of effector memory status (defined by CD27 and CD45RA expression) of Vδ1 T cells isolated from the NT tissue and tumor of one patient (representing n = 23 and n = 22 patients for NT tissue and tumor, respectively). b, Summary radar plot of effector memory status of Vδ1 T cells isolated from NT tissues (n = 23) and tumors (n = 22). The median proportion is plotted. A two-tailed Mann–Whitney U-test was used between NT tissue and tumor within Vδ1 memory subsets. Significant P values are shown. c, Expression of T cell master transcription factors and signature effector molecules of lymphocytes sorted directly from tumors grouped into TH cell, cytolytic and inhibitory modules. Each column represents the denoted cell type from an individual patient. Not all cell types were sorted from matched patients. The color scale denotes the z-score of log2(TPM + 1) of each gene. d, PCA of expression (normalized counts) of genes included in c colored by cell type (n = 9, n = 9, n = 7, n = 5, n = 3 and n = 5 patients for CD4+, CD8+, NK, Treg, Vδ2 and Vδ1 cells, respectively). e, Violin plots showing intracellular cytokine staining for IFN-γ and IL-17A and cell surface staining for CD107A in Vδ1, CD8+ and CD4+ T cells after in vitro stimulation of bulk TILs (n = 3 patients) with PMA and ionomycin (P-I). f, Summary data of correlation between region-matched gene expression of NKG2D ligands and absolute numbers of Vδ1 (n = 14 patients), Vδ2 (n = 14 patients), CD4+ (n = 15 patients) and CD8+ (n = 15 patients) TRM and TEM cells in tumors. The color scale denotes a two-tailed Spearman’s r. * denotes significant correlations as follows: MICA:Vδ1 TEM P = 0.027, MICB:Vδ1 TEM P = 0.031, RAET1E:Vδ1 TEM P = 0.048 and RAET1E:CD8 TEM P = 0.045. g, PCA of expression (normalized counts) of core TRM gene signature (CCR7, CD69, CXCR6, ITGAE, ITGA1, S1PR1 and SELL) in Vδ1 (n = 5 patients), CD4+ (n = 9 patients) and CD8+ T cells (n = 9 patients) sorted from tumors. h, Expression of genes that define ‘stem-like’ CD8+ T cells in Vδ1 (n = 5 patients), CD4+ (n = 9 patients) and CD8+ (n = 9 patients) T cells sorted from tumors. The mean ± s.d. is plotted. A Kruskal–Wallis test with post-hoc Dunn’s test correction for multiple testing was used. All datapoints represent independent patients.

