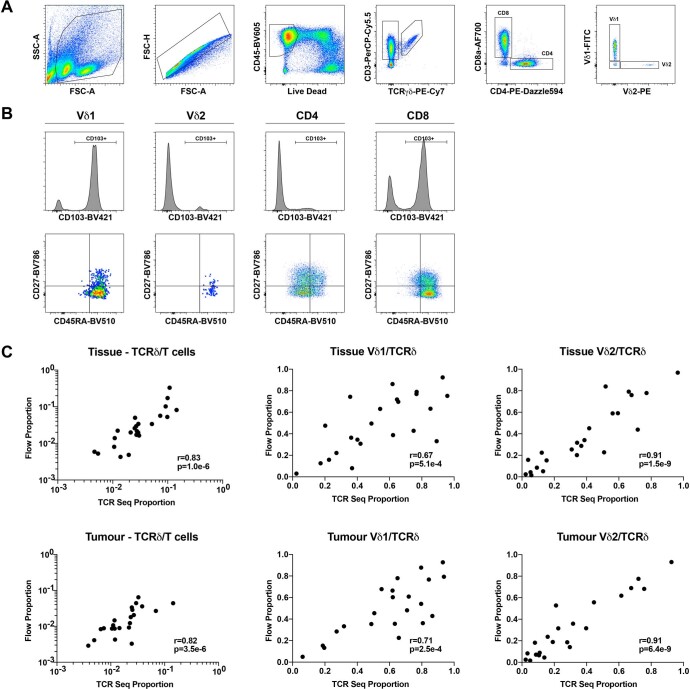
Extended Data Fig. 1. Lung γδ T cells assayed by flow cytometry and TCR sequencing.
A) Representative flow cytometry gating strategy for T cell subsets. From left to right: Forward vs. side scatter gate -> singlet gate -> live CD45 + gate -> CD3 vs. TCRγδ -> CD4 vs. CD8 (of CD3 + /TCRγδ- population) and Vδ1 vs. Vδ2 (of CD3 + / TCRγδ + population) to give CD4 and CD8 αβ T cells and Vδ1 and Vδ2 γδ T cells. B) Representative gating strategy for CD103 and CD45RA vs. CD27 for Vδ1 and Vδ2 γδ T cells, and CD4 and CD8 αβ T cells. C) Proportion of T cell subsets determined by flow cytometry versus proportion determined by TCRseq in NT tissues (n = 23 patients) and tumours (n = 22 patients). Two-tailed Spearman correlation. Significant p values shown. All datapoints represent independent patients.

