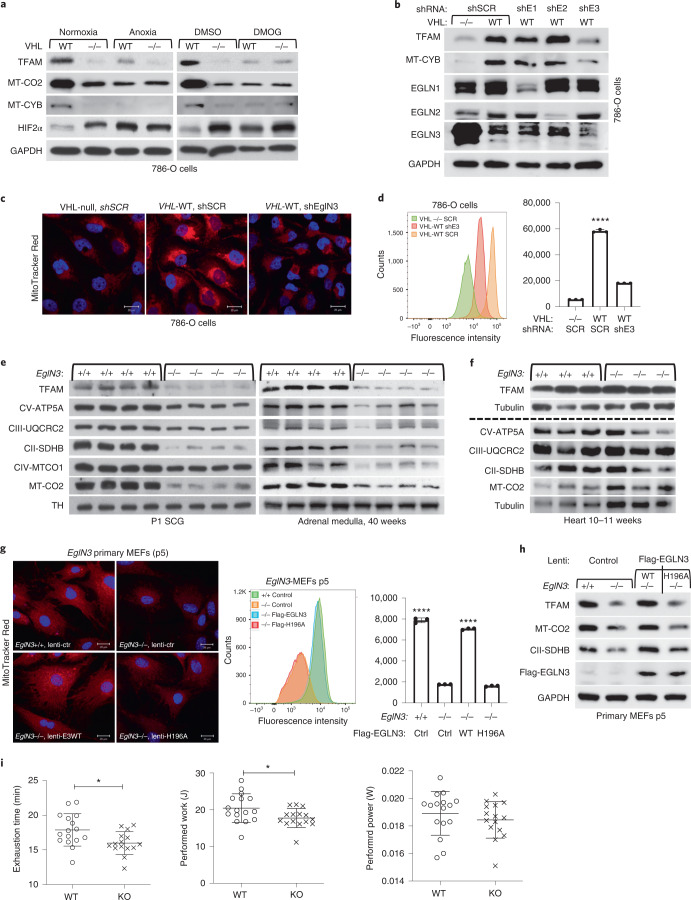
Fig. 2. pVHL regulation of mitochondrial mass is hydroxylation and EGLN3 dependent.
a, Immunoblot analysis of 786-O cells with indicated genotype upon anoxic condition for 16 h or treated with 1 mM DMOG for 8 h. n = 3 biological independent experiments. b, Immunoblot analysis of 786-O cells with indicated VHL status transduced with lentiviral pL.KO shRNA targeting EGLN1 (shE1), EGLN2 (shE2), EGLN3 (shE3) or no targeting control (shSCR). n = 3 biological independent experiments. c, Fluorescence images of 786-O cells with indicated VHL status transduced with lentiviral pL.KO shRNA targeting EGLN3 or no targeting control. Mitochondria are visualized by MitoTracker Red staining. d, Corresponding flow cytometry analysis of MitoTracker Green-stained 786-O cells. Data are presented as mean values ± s.d. One-way ANOVA Tukey’s multiple-comparison Test. ****P < 0.0001. n = 3 biological independent experiments. e, Immunoblot analysis of mouse SCG and adrenal medulla of indicated genotypes. n = 4 biologically independent EGLN3 wild-type or knockout mice. f, Immunoblot analysis of mouse heart of the indicated genotypes. n = 3 biologically independent EGLN3 wild-type or knockout mice. g, Fluorescence images of primary EGLN3 MEFs of the indicated genotypes stably transduced with lentivirus encoding EGLN3 WT, catalytic death mutant EGLN3-H196A or empty control. Mitochondria were visualized by MitoTracker Red staining. Corresponding flow cytometry analysis of MitoTracker Green-stained primary MEFs cells of indicated genotype stably transduced with lentivirus encoding EGLN3 WT, catalytic death mutant EGLN3-H196A or empty control. n = 3 biological independent experiments. Data are presented as mean values ± s.d. One-way ANOVA Tukey’s multiple-comparison test. ****P < 0.0001. h, Corresponding immunoblot of primary EGLN3 MEFs. n = 3 biological independent experiments. i, KO mice aged 56–60 weeks reached exhaustion significantly earlier and performed less work at a comparable performed power (WT n = 16, KO n = 15 independent biological samples per genotype, male mice). Data are presented as mean values ± s.d. Two-tailed unpaired t-test. P = 0.014, P = 0.0318.

