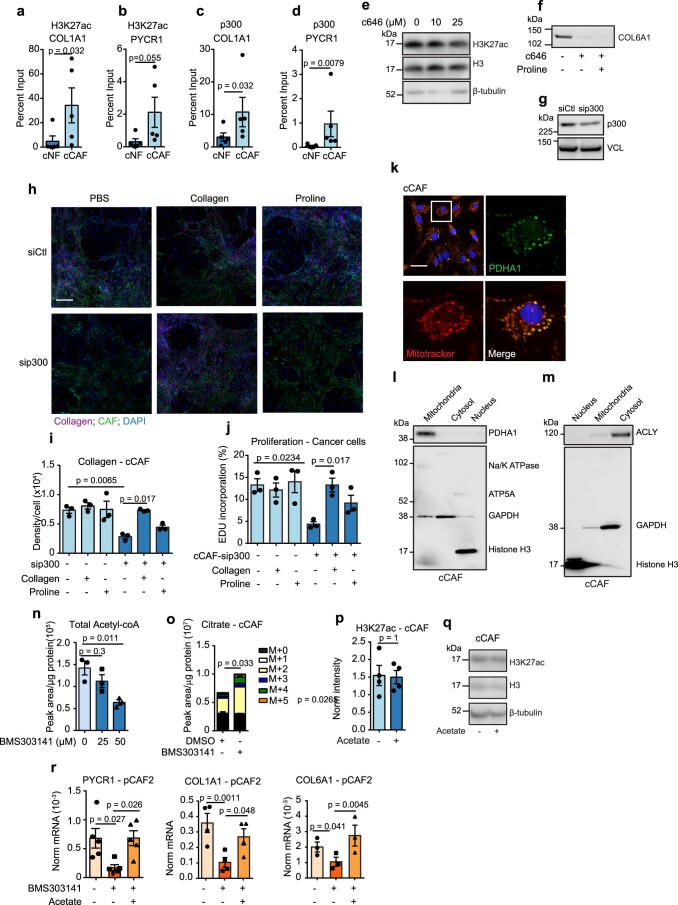
Extended Data Fig. 5. Histone acetylation regulates collagen production in CAFs.
a-d. H3K27ac (a, b) and p300 (c, d) enrichment at COL1A1 and PYCR1 promoter regions in cNFs and cCAFs, measured by ChIP-qPCR. Signal was normalised to the input sample. N = 5 biological replicates. e. Representative of 4 western blots for H3K27ac in cCAFs treated with c646. f. Representative of 4 western blots of COL6A1 produced by cCAFs treated with 25 μM c646/DMSO control and 500 μM proline/PBS control. g. Representative of 3 western blots of EP300 in cCAFs transfected with siCtl/sip300. h, i. Representative images (i) and quantification (j) of collagen in co-cultures of cCAFs transfected with siCtl or sip300, and cancer cells. Cocultures were treated with 500 μM proline, 20 μg/ml collagen I, or PBS control. N = 3 biological replicates. Scale bar = 200 µm j. Proliferation of cancer cells in 2D cocultures of cCAFs transfected with siCtl /sip300, and cancer cells. Cocultures were treated with 500 μM proline, 20 μg/ml collagen I, or PBS as control. N = 3 biological replicates. k. Representative of >10 images of cCAFs showing co-localisation of PDHA1 with mitochondria (MitoTracker). Scale bar = 50 µm. l, m. Representative of 4 western blots of PDHA1 (l) and ACLY (m) in subcellular fractions of cCAFs. Na/K ATPase = membrane marker, ATP5A = mitochondrial marker, GAPDH = cytosolic marker, H3 = nuclear marker. n. Total acetyl-CoA in cCAF treated with DMSO control, or BMS303141 at the indicated concentrations. N = 3 biological replicates. o. 13C-glucose-labelled (coloured) and unlabelled (black) citrate in cCAFs with 50 µM BMS303141/DMSO control. N = 3 biological replicates. p, q. Representative western blot (p) and quantification (q) of H3K27 levels in cCAFs with 1 mM acetate/PBS control. N = 3 biological replicates. r. mRNA levels in pCAF2 with 50 µM BMS303141 or DMSO control and acetate or PBS control. N = 3-5 biological replicates. Error bars indicate mean ± SEM. p-values were calculated with 2-tailed Mann-Whitney test (a-d, n, p), 2-tailed unpaired t-test with Welch’s correction (p) Kruskal-Wallis with Dunn’s multiple comparisons test (i,j,o) or 1-way ANOVA with Dunnett’s multiple comparisons test (r).

