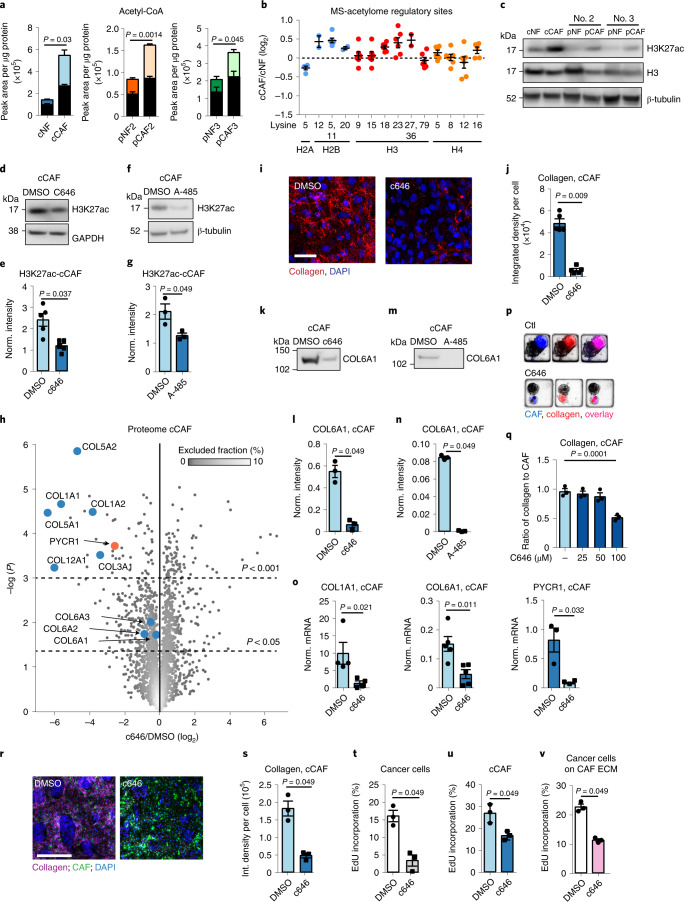
Fig. 5. H3 acetylation regulates collagen production in CAFs.
a, 13C-labelled (coloured) and unlabelled (black) acetyl-CoA in 13C-glucose labelled cCAFs/NFs. n = 3 biological replicates. b, SILAC ratios of regulatory histone acetylation sites identified in cNFs/cCAFs. n = 5 biological replicates. c, Representative of three western blots showing H3K27ac in NFs and CAFs. d,e, Representative western blot (d) and quantification (e) showing H3K27ac in cCAFs with 25 μM c646/DMSO control. n = 5 biological replicates. GAPDH, glyceraldehyde 3-phosphate dehydrogenase. f,g, Representative western blot (f) and quantification (g) showing H3K27ac in cCAFs with 3 μM A-485/DMSO control. n = 3 biological replicates. h, Volcano plot of cCAF proteome with 25 μM c646/DMSO control. n = 3 biological replicates. Plot coloured using density estimation function in MaxQuant. i,j, Representative images (i) and quantification (j) cCAF-derived collagen with 25 μM c646/DMSO control. n = 5 biological replicates. k,l, Representative western blot (k) and quantification (l) of COL6A1 in cCAF-derived ECM with 25 μM c646/DMSO control. n = 3 biological replicates. m,n, Representative western blot (m) and quantification (n) of COL6A1 cCAF-derived ECM with 3 μM A-485/DMSO control. n = 3 biological replicates. o, mRNA quantification in cCAFs with 25 μM c646/DMSO control. n ≥ 3 biological replicates. p,q, Representative images (p) and quantification (q) of collagen in 3D CAF/cancer cell cocultures with c646/DMSO control. n = 3 biological replicates. r,s, Representative images (r) and quantification (s) of collagen in 2D CAF/cancer cell cocultures with 25 μM c646/DMSO control. n = 3 biological replicates. t,u, Proliferation of cancer cells (t) and CAFs (u) in 2D coculture with 25 μM c646/DMSO control. n = 3 biological replicates. v, Proliferation of cancer cells seeded on ECM from CAFs treated with 25 μM c646/DMSO control. n = 3 biological replicates. Error bars indicate mean ± s.e.m. Significance was calculated with two-tailed, unpaired t-test with Welch’s correction (a and o), two-tailed Mann–Whitney test (e, g, j, l, n, s, t, u and v) or one-way ANOVA with Dunnett’s multiple comparison test (q). Scale bars, 50 µm (i) and 200 µm (r). See Extended Data Fig. 9 for Ponceau S staining of blots used for COL6A1 in ECM, used as loading control.

