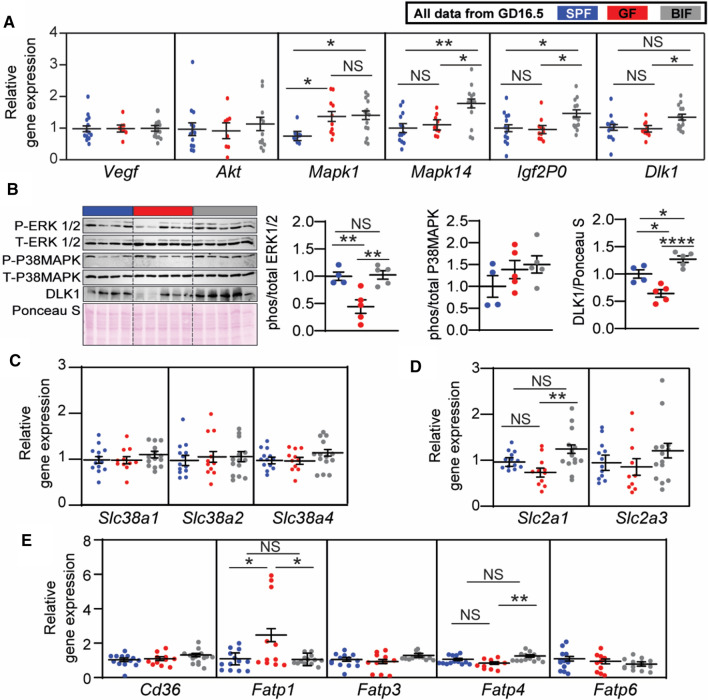
Fig. 3.
Effects of maternal gut microbiome and B. breve supplementation during pregnancy on placental gene and protein levels on day 16.5 of gestation. A Gene expression levels in micro-dissected labyrinth zones. B Immunoblots and protein quantification by Western blot in micro-dissected labyrinth zones. C–E Gene expression levels in micro-dissected labyrinth zones for amino-acids, glucose and lipid transporters. Western blot data were analysed by one-way ANOVA. qPCR data were analyzed by a general linear mixed model, taking into account litter size as a covariate and taking each fetus as a repeated measure followed by Tukey multiple comparisons test. ROUT test was used for the identification of outlier values. Dots represent raw data (individual values). However, the statistical analysis and the mean ± SEM reported within the graphs (for qPCR data) were obtained with the general linear mixed model (further explanations can be found in the Materials and Methods, statistical analysis section). Gene expression analysis was performed with: SPF (13 placentas from 6 dams), GF (11 placentas from 5 dams) and BIF (14 placentas from 6 dams). Protein quantification was performed with: SPF (4 placentas from 4 dams), GF (5 placentas from 5 dams) and BIF (5 placentas from 5 dams). Only placentas collected on day 16.5 of gestation were analysed. For qPCR, one to three placentas per litter were assessed and selection of the samples was conducted at random. For protein expression analysis, 1 placenta per litter was selected (NS, not significant; *P < 0.05; **P < 0.01; ****P < 0.0001)

