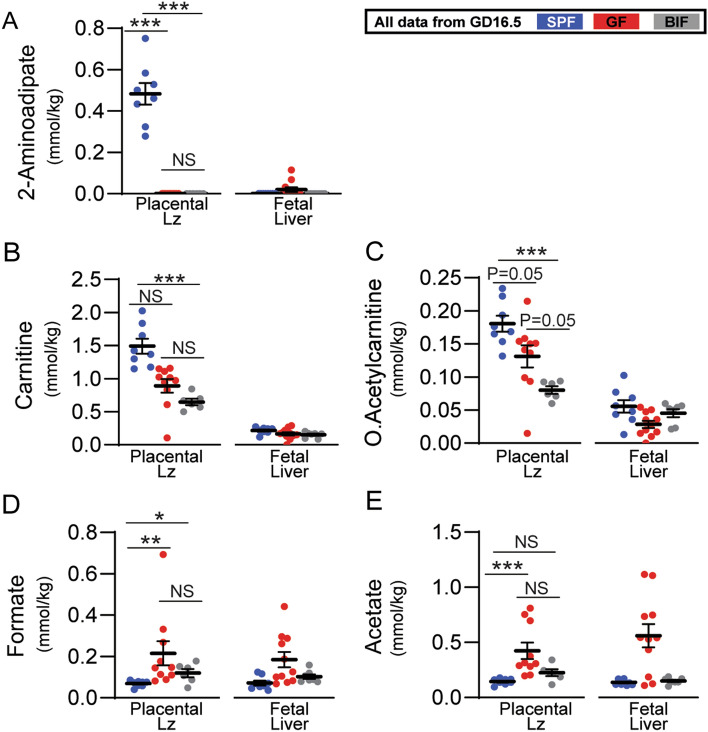
Fig. 4.
Metabolomic profiling of placental labyrinth zone and fetal liver on day 16.5 of gestation. Data were analysed by Kruskal–Wallis test followed by multiple comparisons using the Benjamini & Hochberg false discovery rate method and Dunn's test. ROUT test was used for the identification of outlier values. Data presented as mean ± SEM. Number of litters analysed per group: SPF (8 placentas-livers from 4 dams), GF (8–7 placentas-livers from 4–5 dams), BIF (6–7 placentas-livers from 5 dams). Only tissues collected at GD16.5 were analysed. Selection of the samples was conducted at random (NS, not significant; *P < 0.05; **P < 0.01; ***P < 0.001)

