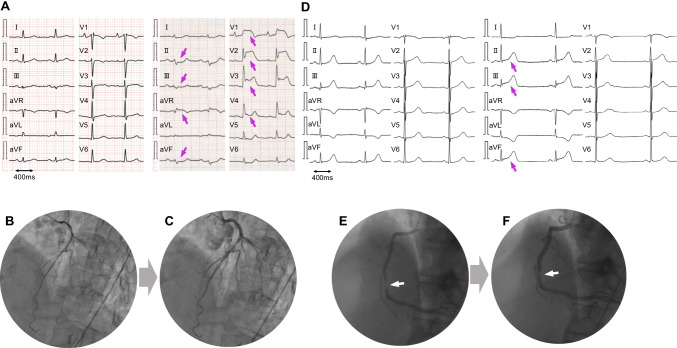
Fig. 1.
Electrocardiograms and coronary angiograms during the ST-T elevation. A–C The electrocardiogram (ECG) (A) demonstrates ST-T elevation in the precordial leads in case 1 (69 years old, male). The coronary angiography before (B) and after an intra-coronary nitroglycerin injection (C) reveals coronary artery spasms. D–F An ECG in case 2 showing ST-T elevation in leads II, III, and aVF (D). A 90% stenosis of the right coronary artery is shown (E); however, an intra-coronary nitroglycerin injection relieved the stenosis (F)

