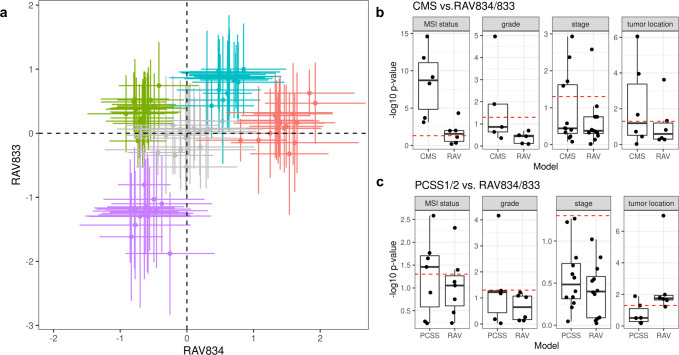
Fig. 3. Sample scores for disease subtyping and metadata characterization.
Sample scores from RAV834 and RAV833 were assigned to 3567 tumor samples from 18 colorectal carcinoma (CRC) studies. a All the sample from 18 datasets were assigned to either (i) one of the 4 previously proposed Consensus Molecular Subtypes (CMS) subtypes by CRC Subtyping Consortium (labeled with non-gray colors) or (ii) not assigned to a CMS subtype (gray), which comprised of 90 groups (5 subtype groups for 18 datasets). Each of these 90 groups is represented by the mean (point) and standard deviation (error bar) of sample scores. CMS subtypes separate when plotted against RAV834/833 coordinates. We further evaluated the capacity of RAVs to demonstrate clinicopathological characteristics of colon cancer. b Clinical phenotypes were regressed on discrete CMS subtypes and RAV834/833-assigned sample scores as covariates. Likelihood-ratio tests (LRTs) were used to compare the full model to a simplified model containing only CMS subtype (CMS, left box) or RAV834/833-assigned sample scores (RAV, right box) as predictors. RAV834/833-only model shows -log10p-value near 0, implying that CMS is not providing additional information. c The same regression and LRTs as in panel (b) were done using PCSS1/2 and RAV834/833-assigned sample scores as covariates. RAV834/833 outperforms PCSS1/2 on explaining colon cancer phenotypes except tumor location. Boxplot statistics are summarized in Supplementary Data 5 and raw data are included in Supplementary Data 6.

