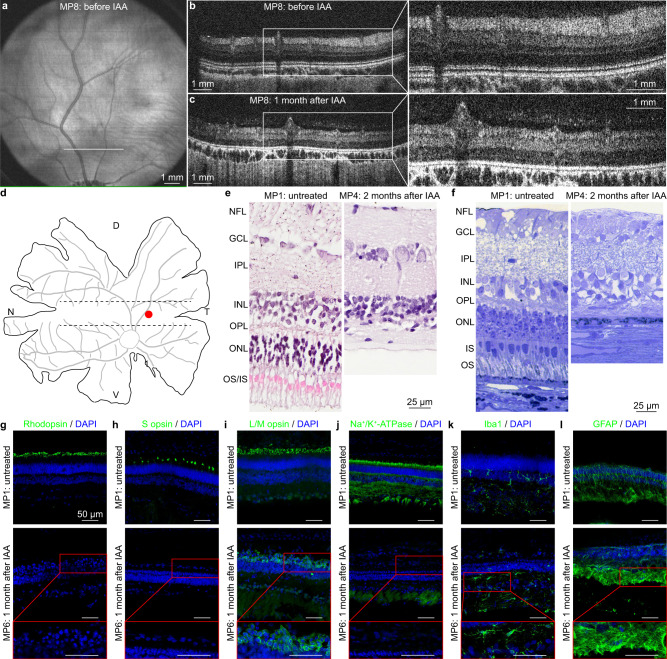
Fig. 1. Retinal imaging in blind minipigs.
a Fundus image before IAA administration. b, c SD-OCT images of the retina before and 1 month after IAA administration, taken 2 mm above the optic disc (white line in panel a). The white boxes show a magnification of the retinal sections. Panels a–c are from MP8. d, Drawing of a flattened retina. The dashed lines delimit the area centralis, while the red circle indicates the point in the area centralis (central temporal) corresponding to the images in panels e–l. D dorsal; T temporal; V ventral; N nasal. e H&E staining of a retinal section in the area centralis (red circle in d) before and 2 months after IAA administration. NFL nerve fibre layer; GCL ganglion cell layer; IPL inner plexiform layer; INL inner nuclear layer; OPL outer plexiform layer; ONL outer nuclear layer; IS inner segments; OS outer segments. f, Semithin optical image of a retinal section in the area centralis (red circle in d) before and 2 months after IAA administration. Images in panels e, f are from MP1 and MP4. g–l IHC staining of a retinal section in the area centralis (red circle in d) against rhodopsin (g), S opsin (h), L/M opsin (i), Na+/K+-ATPase (j), Iba1 (k), and GFAP (l) before and 1 month after IAA administration. The red inserts show magnifications of the retinal sections 1 month after IAA administration. All scale bars in panels g–l are 50 µm. Images in panels g–l are from MP1 and MP6. H&E and IHC analyses have been performed at various time points (n = 1 eye from N = 1 minipig per time point).

