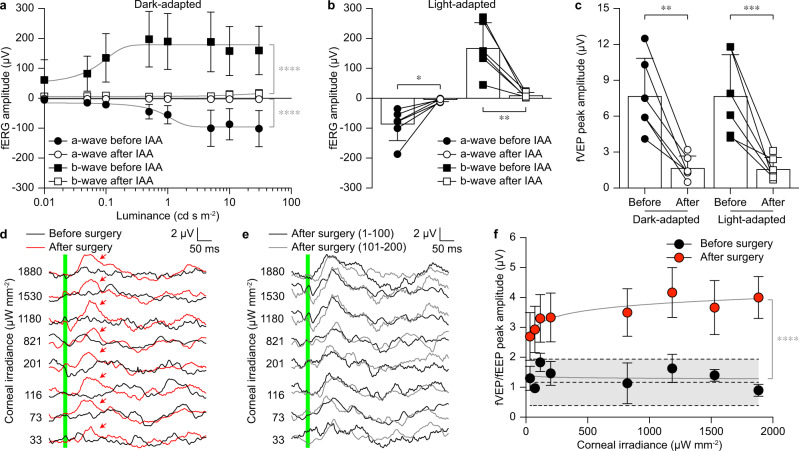
Fig. 7. Functional validation of POLYRETINA in blind minipigs.
a Quantification of the dark-adapted fERGs in IAA-treated minipigs before and after IAA administration (mean ± s.d., n = 6 eyes from N = 3 minipigs). Grey lines are the logistic growth regressions (a-wave before: R2 = 0.49543; a-wave after: R2 = 0.0231; b-wave before: R2 = 0.2587; b-wave after: R2 = 0.1300). Extra sum-of-squares F test; p < 0.0001 (****) for both a-wave and b-wave. b Quantification of the light-adapted fERGs before and after IAA administration (mean ± s.d., n = 6 eyes from N = 3 minipigs). Two-tailed paired t-test; a-wave: p = 0.0138 (*) and power 0.98; b-wave: p < 0.0053 (**) and power 1.00. c Quantification of the dark-adapted and light-adapted fVEPs in IAA-treated minipigs before and after IAA administration (mean ± s.d., n = 6 eyes from N = 3 minipigs). Two-tailed paired t-test; dark-adapted: p = 0.0012 (**) and power 1.00; light-adapted: p = 0.0008 (***) and power 0.99. d fVEPs and fEEPs were recorded immediately before (fVEPs, black) and immediately after (fEEPs, red) POLYRETINA implantation at increasing irradiance levels at the cornea. The green bar corresponds to the 10-ms long light pulse. Red arrows show the peak responses with POLYRETINA. e fEEPs recorded after POLYRETINA implantation were obtained from d by averaging two blocks of 100 consecutive responses. The green bar corresponds to the 10-ms long light pulse. f Quantification of the peak-to-peak amplitudes as a function of corneal irradiance before (black, fVEP) and after (red, fEEP) POLYRETINA implantation (mean ± s.d., n = 3 eyes from N = 3 minipigs). The grey area between dashed lines corresponds to the mean (±s.d.) biological noise obtained in each minipig from control trials without light stimulation. Grey lines are the semi-log regressions (before surgery: R2 = 0.0067; after surgery: R2 = 0.2847). Extra sum-of-squares F test; p < 0.0001 (****). Data in panels a–c, f are from MP9–11. Data in panels d, e are from MP9. Source data are provided as a Source Data file.

