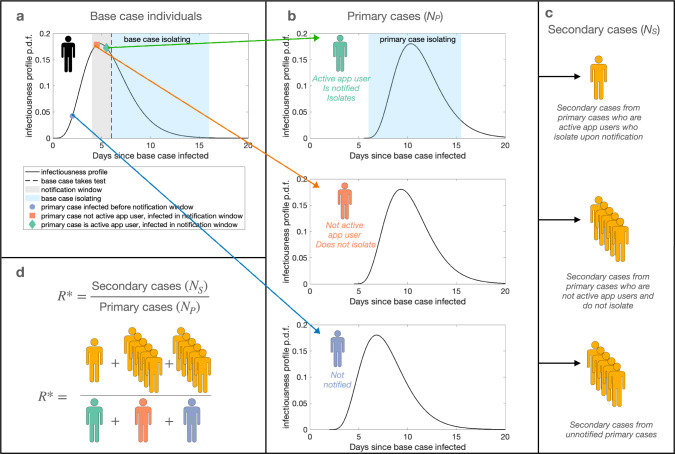
Fig. 1. Schematic illustrating the modelling approach.
a The infectiousness of a base case individual varies through time. A base case individual takes a test on day d in their infectiousness profile (dashed line), after which they isolate (light blue shaded area). b Primary cases with the app who are infected by the base case from day d − w to day d are notified of possible exposure. A proportion p of individuals infected within the notification window adhere to self-isolation (green, top panel), while a proportion (1 − p) of individuals are not active app users and do not self-isolate (orange, middle panel). Adhering individuals self-isolate from notification until inotif days have elapsed since contact with the base case. Primary cases infected before day d − w are not notified (blue, bottom panel). Those who do not adhere to isolation upon notification or who are not notified either mix normally in the population throughout their infectious period or they isolate upon symptom onset. c The expected number of secondary cases resulting from non-adhering or unnotified primary cases is higher than the expected number of secondary cases that result from primary cases who adhere to isolation after notification. d R* is calculated as the ratio between the expected number of secondary cases and the expected number of primary cases—in our illustrative example, the expected number of secondary cases is 11, and the expected number of primary cases is 3, giving R* = 11/3.

