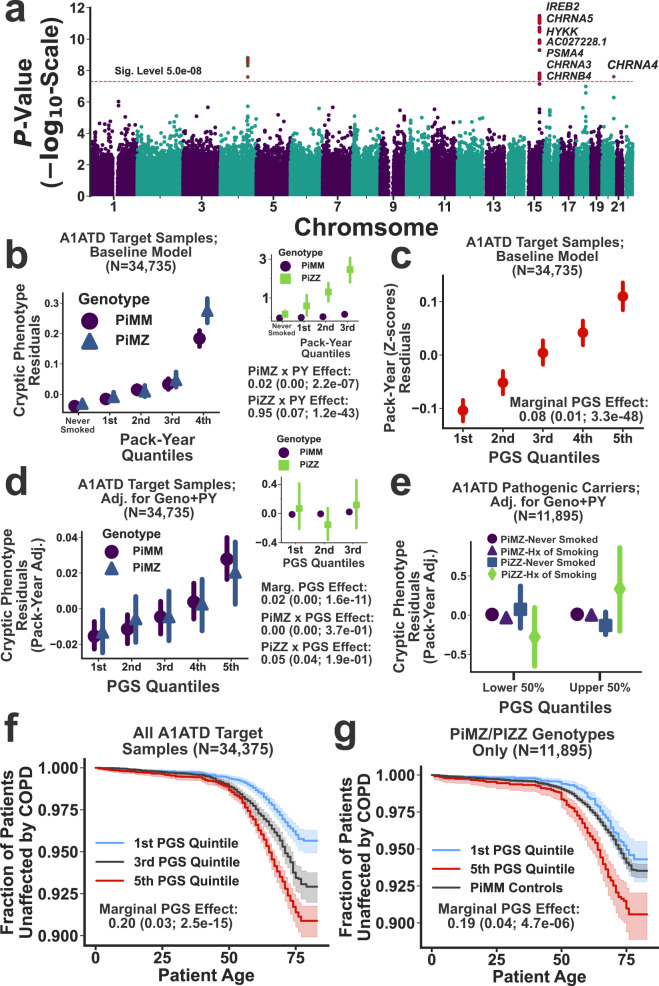
Fig. 5. Cryptic phenotype-associated genetic variation modifies A1ATD severity.
a Manhattan plot displaying the genome-wide association statistics as a function of chromosomal position. Genes were assigned to loci using FUMA75. The significance threshold is displayed as a dashed red line, and significant loci are highlighted with red stars. b Cryptic phenotype (CP) residuals are stratified by the Pi*MZ/Pi*MM genotypes and plotted as function of pack-year quantiles. Inset: CP residuals plotted against pack-year quantiles, now stratified by the Pi*ZZ/Pi*MM genotypes. In both panels, the points represent the mean value within each quantile, and the error bars represent the 95% confidence intervals (CIs) for the mean (obtained through bootstrapped re-sampling, N = 1000). The association statistics for the genotype x smoking interaction terms are included below the inset (estimated using linear regression and two-sided T-tests). c Smoking history (expressed as pack-years) is plotted against PGS quantiles (points/error bars indicate quantile means/95% CIs). d CP residuals, after adjusting for baseline covariates, genotype, and smoking history, are plotted against PGS quantiles and stratified by the Pi*MZ/Pi*MM genotypes. The inset displays the same information but now stratified by the Pi*ZZ/Pi*MM genotypes. Both panels depict the quantile means and their associated 95% CIs. The association statistics for the PGS effects (estimated using linear regression and two-sided T-tests) are included below the inset. e CP residuals within the upper and lower 50th percentiles of the PGS distribution are stratified by both genotype and smoking history (points/error bars represent subset means/95% CIs). f Kaplan–Meier curves for COPD onset after stratifying the target cohort according PGS quintiles. g Same as in f, except only subjects with the Pi*MZ/Pi*ZZ genotypes are included. The PGS effect size and association statistics (computed using a Cox Proportional-Hazards model, see the “Methods” section) are provided for the subjects depicted in f and g. The shaded regions represent the 95% CIs for the survival curves. The summary statistics reported in this figure were not adjusted for multiple testing.

