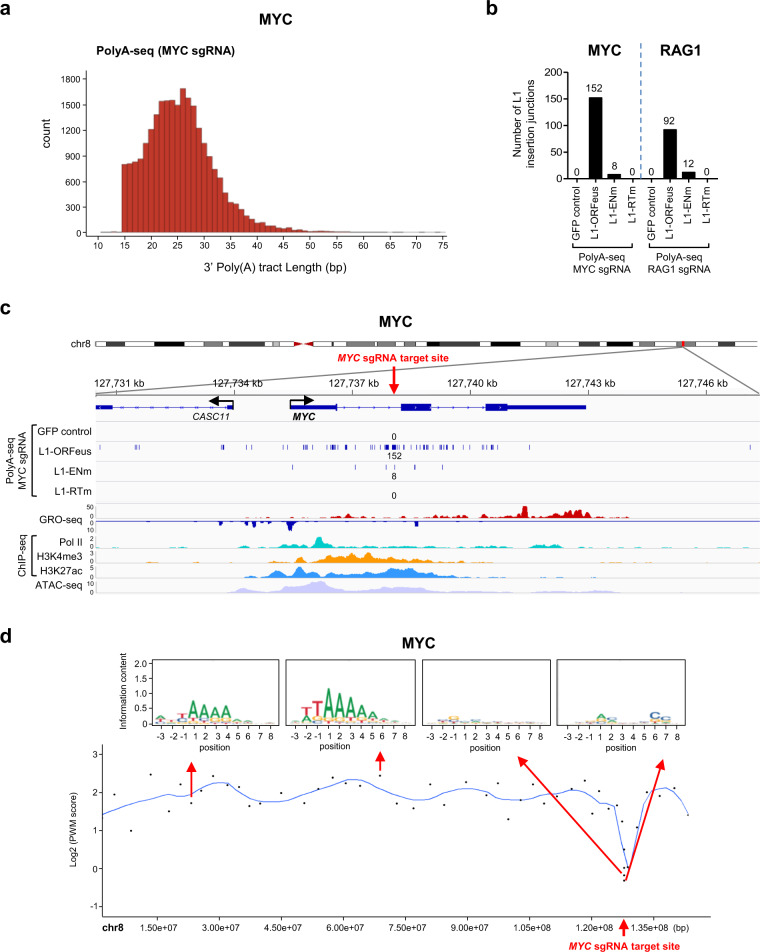
Fig. 3. EN consensus motif-independent de novo L1-ORFeus insertions at CRISPR/Cas9 target sites.
a Distribution of 3′ Poly(A) tract lengths of L1-ORFeus insertions obtained by PolyA-seq in HEK293T cells expressing L1-ORFeus and targeted by MYC CRISPR/Cas9. b Numbers of L1-ORFeus insertions obtained by PolyA-seq at the MYC locus targeted by MYC CRISPR/Cas9 (b, left) or at the RAG1 locus targeted by RAG1 CRISPR/Cas9 (b, right) in HEK293T cells expressing L1-ORFeus, L1-ENm, L1-RTm, or GFP control. c Detailed view of the distribution of L1-ORFeus insertions at the MYC locus obtained by PolyA-seq in HEK293T cells targeted by MYC CRISPR/Cas9 expressing L1-ORFeus, L1-ENm, L1-RTm, or GFP control. Each line corresponds to an independent L1-ORFeus insertion; number of L1-ORFeus insertions is pooled from two independent PolyA-seq. Corresponding GRO-seq, ChIP-seq (including Pol II, H3K4me3, and H3K27ac), and ATAC-seq profiles are shown (c, bottom). Red arrow shows the MYC CRISPR/Cas9 target site. d Top: Sequence logo representing the consensus motif detected at L1-ORFeus pre-integration sites in example regions proximal or distant to the MYC CRISPR/Cas9 DSB. Each dot represents a chromosomal region encompassing 30 independent L1-ORFeus insertions. Bottom: Spline interpolation curve of consensus motif position-weighted matrix (PWM) score in chromosome 8 obtained by PolyA-seq in HEK293T cells targeted by MYC CRISPR/Cas9 that express L1-ORFeus. The mean interval size covered by the chromosomal region encompassing 30 independent L1-ORFeus insertions was 1353.5 bp (range 198–8440 bp) within approx. ±5 kb of the MYC CRISPR/Cas9 target site, and 2,824,123 bp (range 801,848–6,764,412 bp) outside of the CRISPR/Cas9 target site.

