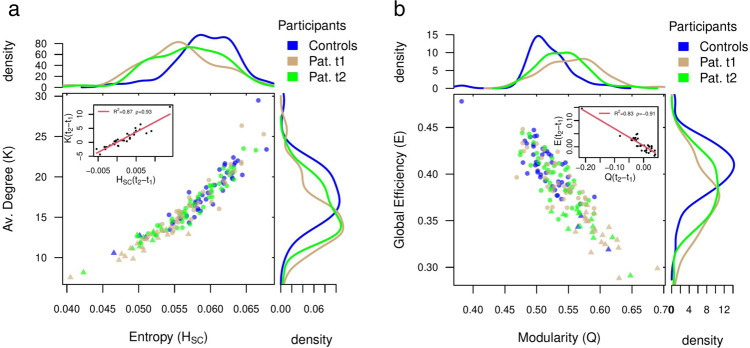
Fig. 4. Alterations in network topology and associated changes in criticality regime.
a Average degree (K) versus connectivity disorder (i.e., structural entropy HSC) for all patients and controls. Controls are colored in blue (n = 46). Brown dots represent patients at t1 (3 months post-stroke, n = 54), while green dots at t2 (12 months post-stroke, n = 59). Normalized density plots (histograms) are also shown. Triangular dots correspond to patients who have S2 monotonic decay and so lack of criticality. In the inset we show the recovery indexes (see main text) K(t2 − t1) versus HSC(t2 − t1). In the legend, we show the (linear) correlation, ρ and the R2. Normalization of both, the average degree and the connectivity disorder, from t1 to t2 supports the corresponding recovery of patients criticality. b The same as a but for the global efficiency (E) and modularity (Q). Strokes cause an overall decrease in global efficiency at the cost of an associated increase in modularity, but that recovers from t1 to t2 towards the controls. Source data are provided as a Source Data file.

