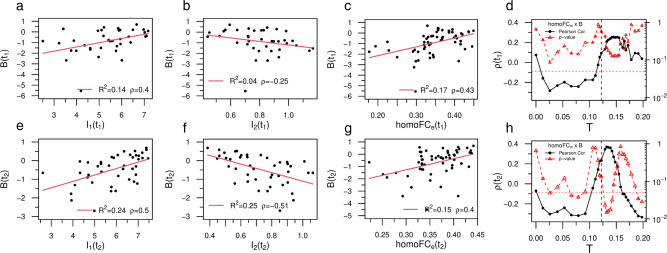
Fig. 6. Relationship between recovery of criticality, functional connectivity, and behavior.
a, e Correlation between I1 and behavior at t1 and t2, respectively. The legend shows the (linear) correlation, ρ and the R2. b, f Same but for I2. The dynamical variables (I1, I2) predicted a significant amount of behavioral variance, higher at t2. c, g Correlation between empirical homotopic FCe and behavior at t1 and t2, respectively. d, h Linear correlation between model homo-FCm and behavior for different values of the excitation threshold T. Near the critical point (Tc, black vertical lines) the stochastic model reproduces the positive correlation with behavior observed empirically (black dots) with a corresponding peak in the statistical significance (red triangles). Note the sharp increase in correlation as T nears the critical point and the subsequent fall of as T becomes subcritical. We added red horizontal lines at p = 0.05 for ease interpretation. All the p-values were Benjamini–Hochberg corrected for multiple comparisons with false discovery rate (FDR) of α = 0.05. The p-value reported in panel b did not remain significant after correcting. However, note the abnormal behavior of a single individual close to B(t1) ~ −6. Removing this outlier from the analysis we obtain ρ = − 0.42 with p-value < 0.05. See Supplementary Table 2 for accessing the sample size and the significance for all the tests. The (two-tailed) p-values reported in panels (d, h) were not corrected for multiple comparisons. Source data are provided as a Source Data file.

