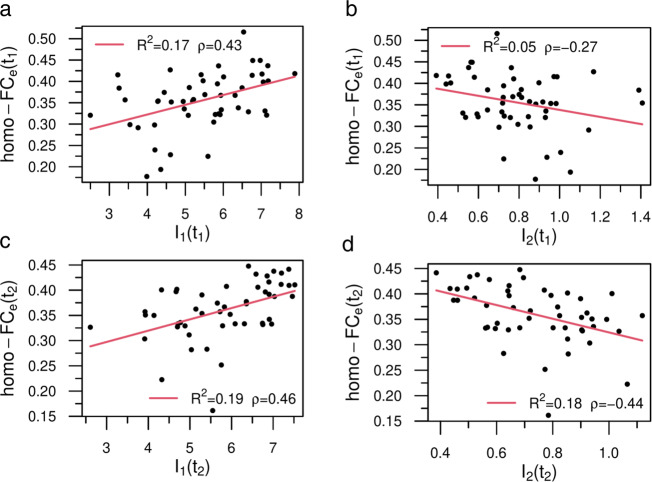
Fig. 7. Statistical correlates between model dynamical patterns and empirical homotopic functional connectivity.
In the legend we show the (linear) correlation, ρ and the R2. a, c Relationship between I1 and empirical homo-FCe at t1 and t2, respectively. b, d The same as before, but for I2. Both dynamical variables predicted a significant amount of functional variance, but panel b did not remain significant after correcting at level of α = 0.05. Sample size (n = 50). Source data are provided as a Source Data file.

