
Figure 4.
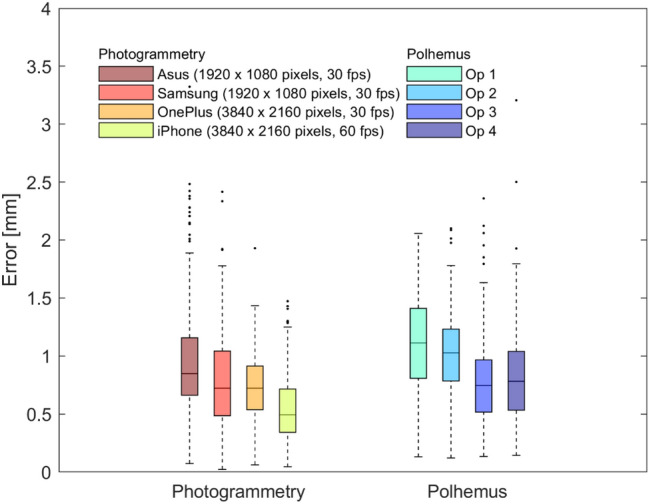
Localization errors for the sensor positions obtained with photogrammetry and Polhemus for the head phantom. Boxplots represent the distribution of the errors across sensor positions, separately for each employed smartphone for the photogrammetry-based method (on the left) and for each operator for the Polhemus (on the right). Bottom and top edges of the box indicate the 25th and 75th percentile, whereas the central mark indicates the median. Outliers are depicted as dots.