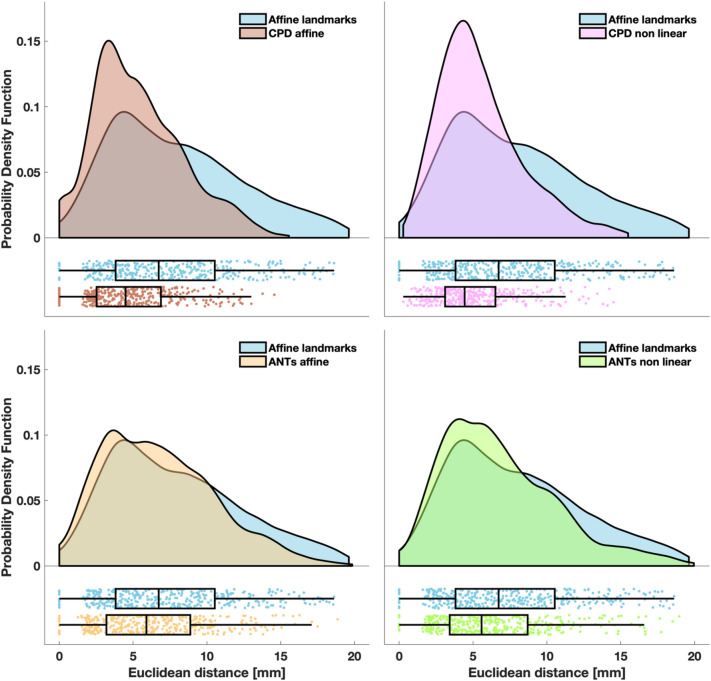
Figure 5.
Euclidean distance between the benchmarks of the sensor positions and the registered positions. The probability density function of the localization errors obtained with CPD affine (top left panel), CPD non linear (top right panel), ANTs affine (bottom left panel) and ANTs non linear (bottom right panel) are superimposed to the probability density function of the localization errors obtained with the affine transformation based on landmarks. In the lower part of each panel, the same data are presented as a box plot. Left and right edges of the box indicate the 25th and 75th percentile, whereas the central mark indicates the median. The whiskers extend to the most extreme data value not considered an outlier. Each dot represents a sensor of a participant. Probability density functions were estimated with the kernel density estimation method and graphs were generated as described in Allen et al.65.

