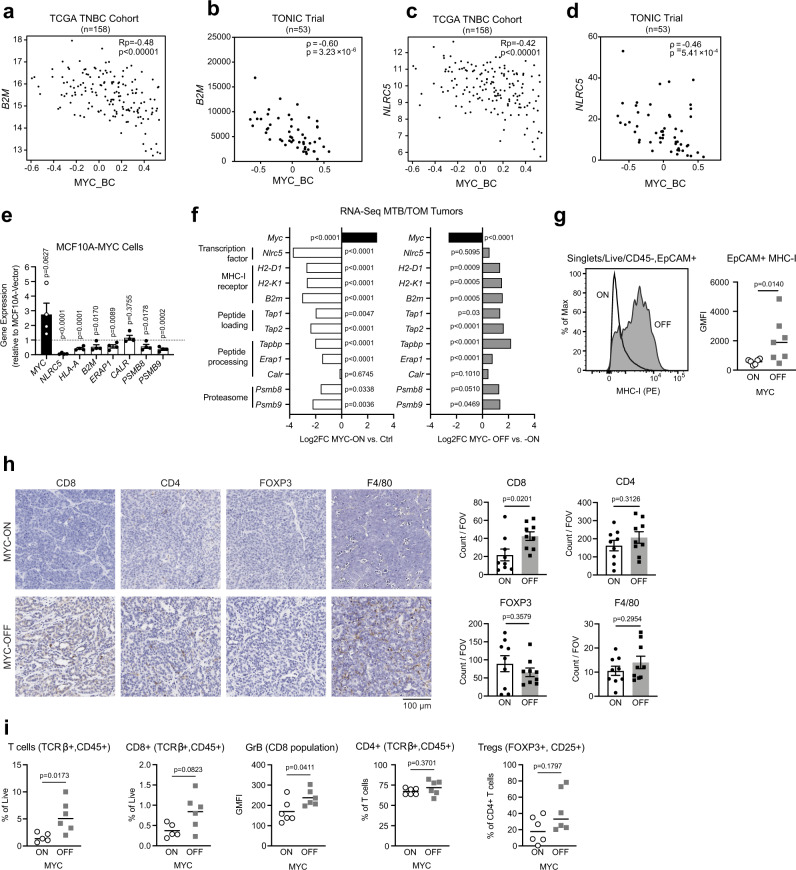
Fig. 2. MYC suppression of MHC-I expression is reversible.
a–d Scatter plot correlation tested between the expression of (a) B2M gene and MYC_BC signature in TCGA TNBC patients, Pearson’s coefficient (Rp), adjusted p-value (Benjamini-Hochberg FDR corrected). b B2M and the MYC_BC signature in TONIC Trial patients, Spearman’s r (ρ), exact p-value. c NLRC5 gene and MYC_BC signature in TCGA TNBC patients, Pearson’s coefficient (Rp), adjusted p-value (Benjamini–Hochberg FDR for corrected). d NLRC5 gene and the MYC signature in the TONIC Trial patients, Spearman’s r (ρ), exact p-value. e Antigen presentation pathway genes in MCF10A-MYC cells compared to MCF10A-vector cells. Data displayed as fold change with values < 1 (dotted line) equating to gene repression. Displayed n = 4 independent cell passage replicates. Mean ± S.E.M, two-sided, unpaired t-test, exact p-values. f Differential expression analysis for RNA-seq data in MTB/TOM tumors published by Rohrberg et al. Left: MYC-ON compared to normal mammary tissue (Ctrl), Right: 3 days off-doxycycline (MYC-OFF) compared to animals on doxycycline (MYC-ON). Adjusted p-values. g Representative histogram for MHC-I expression by flow cytometry in MYC-ON and MYC-OFF states. Adjacent bar graph displaying geometric mean fluorescence intensity (GMFI) for MHC-I in MYC-ON (n = 6) and MYC-OFF (n = 7). Line represents median, data points represent individual animals, two-sided, Mann–Whitney test, exact p-value. h Immunohistochemistry staining of immune cell markers within tumor sections in MYC-ON and MYC-OFF state. Images are at 20X. Adjacent bar graphs displaying cumulative counts per field of view (FOV). n = 3 animals per group, 3 FOV analyzed per tumor, mean ± S.E.M. two-sided unpaired t-test, exact p-values. i Flow cytometry analysis of immune cells found in MYC-ON tumors or MYC-OFF tumors (off doxycycline chow for 3 days) (n = 6 per group). Line represents median, data points are individual animals, outliers removed, two-sided Mann–Whitney test, exact p-values. Source data are provided in the Source Data file. Source data for panels b and d provided at EGA (EGAS00001003535).

