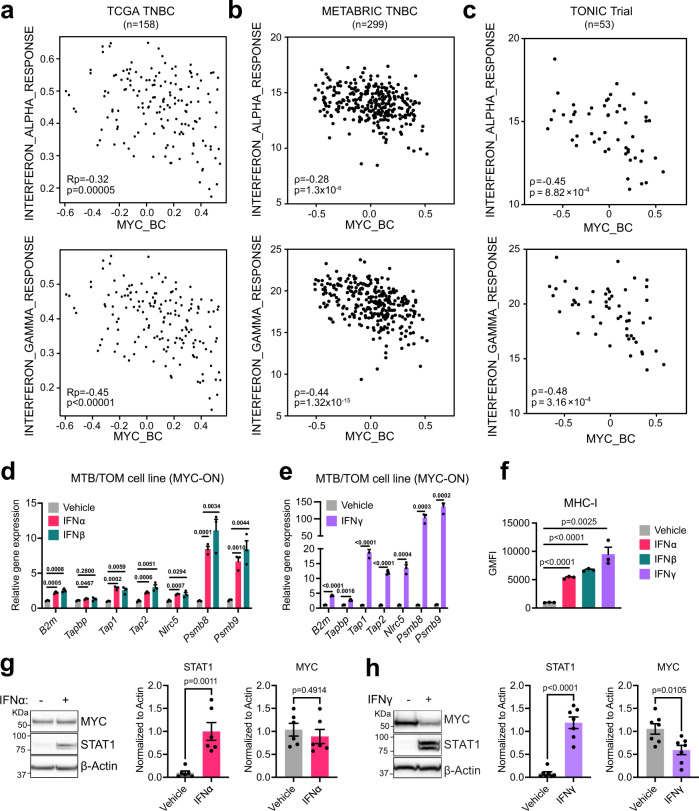
Fig. 3. Interferon signaling rescues MHC-I in MYC-elevated cells.
a–c Scatter plot correlation tested between the expression of Hallmark Interferon Alpha Response signature or Hallmark Interferon Gamma Response signature and the MYC_BC signature in a TCGA TNBC patients, Pearson’s coefficient (Rp), adjusted p-value (Benjamini–Hochberg FDR corrected); b METABRIC TNBC, ρ, Spearman’s r and exact p-value; and c TONIC Trial, ρ, Spearman’s r and exact p-value. d, e Gene expression analysis after 72 h of d vehicle, interferon alpha, and interferon beta, or e interferon gamma treatment in the presence of doxycycline, in MTB/TOM cells grown in vitro culture. Representative experiment with three samples per condition shown. Mean ± S.E.M, unpaired t-test with Benjamini–Hochberg FDR = 0.05, adjusted p-values displayed across the bars. Trends repeated with three independent cell passages. f Flow cytometry results displayed as geometric mean fluorescence intensity (GMFI) for MHC-I in MTB/TOM cell line in vitro culture after 72 h of treatment. Representative experiment with three samples per condition shown. Mean ± S.E.M, two-sided, unpaired t-test, exact p-values. Trends repeated with three independent cell passages. g, h Left: Representative western blots showing MYC levels in the MTB/TOM cell line after 72 h of treatment with g interferon alpha (n = 6 independent cell passages) or h interferon gamma (n = 7 independent cell passages). Right: densitometry ratio of MYC or STAT1 to ß-actin shown from independent cell passages. Two-sided, unpaired t-test, exact p-values. Source data are provided in the Source Data file. Source data for panel c provided at EGA (EGAS00001003535).

