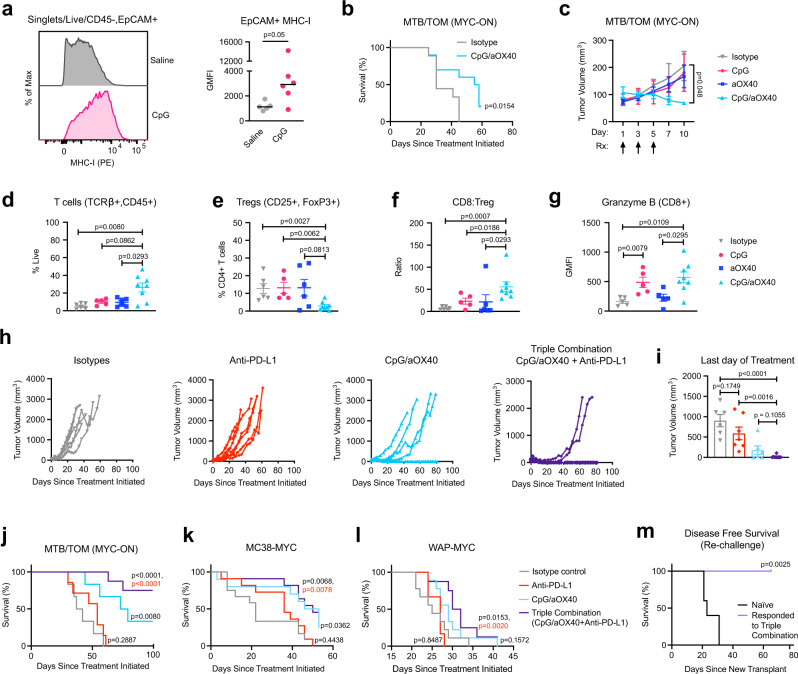
Fig. 4. CpG/aOX40 enhances anti-PD-L1 in vivo.
a Representative histogram of cell surface MHC-I detected by flow cytometry. Adjacent bar graph displaying geometric mean fluorescence intensity (GMFI). Line represents median, data points represent individual animals, saline (n = 5), CpG (n = 6), Mann–Whitney test, exact p-value. b Survival (time to endpoint length: 20 mm) for animals given CpG/anti-OX40 (aOX40) (n = 10) or isotype/vehicle (n = 9). Log rank test, exact p-value. c Tumor volume following treatments (Rx) indicated by arrows. Isotype (n = 6), CpG (n = 5), aOX40 (n = 6), CpG/aOX40 (n = 5). Mean ± S.E.M, two-sided, unpaired t-test comparing tumor volume on day 10 in isotype treated vs. CpG/aOX40, exact p-value. d–g Flow cytometry analysis of immune cells found in the tumor post-treatment initiation day 10. Isotype (n = 6), CpG (n = 5), anti-OX40 (n = 6), CpG/aOX40 (n = 8). Mean ± S.E.M., Mann–Whitney test., exact p-values: d Percent of live cells in the tumor that are T-cells. e Percent of CD4+ (gating: Singlets/Live/TCRβ+, CD45+/CD8−, CD4+) T-cells that are CD25+ and FOXP3+. f Ratio of CD8+ (gating: Singlets/Live/TCRβ+, CD45+/CD8+, CD4−) T-cell counts to Treg counts (gating: Singlets/Live/TCRβ+, CD45+/CD8−, CD4+/CD25+, FOXP3+). g Geometric mean fluorescence intensity for intracellular granzyme B in the CD8+ T-cells (gating: Singlets/Live/TCRβ+, CD45+/CD8+, CD4−). h MTB/TOM tumor volumes graphed to endpoint: isotype (n = 6), anti-PD-L1 (n = 7), CpG/aOX40 (n = 6), and triple combination (n = 9). i Tumor volume in MTB/TOM animals after last day of treatment (related to panel h). Mean ± S.E.M., two-sided, unpaired t-test, exact p-value. j–l Survival (time to ethical endpoint length = 20 mm). Log rank test for each treatment arm in comparison to isotype arm, exact p-value in black. Log rank test for anti-PD-L1 compared to triple combination, exact p-value in red: j MTB/TOM (MYC-ON) animals from panel h. k MC38-MYC model, isotype (n = 12), anti-PD-L1 (n = 11), CpG/aOX40 (n = 10), triple combination (n = 11). l WAP-MYC model, isotope (n = 9), anti-PD-L1 (n = 6), CpG/anti-OX40 (n = 9), and triple combination (n = 8). m Disease-free survival in MTB/TOM model (defined as time to palpable tumor). Mice previously treated with triple combination and eradicated their tumors were transplanted with a new MTB/TOM tumor on the contralateral side. Tumor naïve group (n = 5) and responded to therapy group (n = 5). Log rank test, exact p-value. Source data are provided in the Source Data file.

