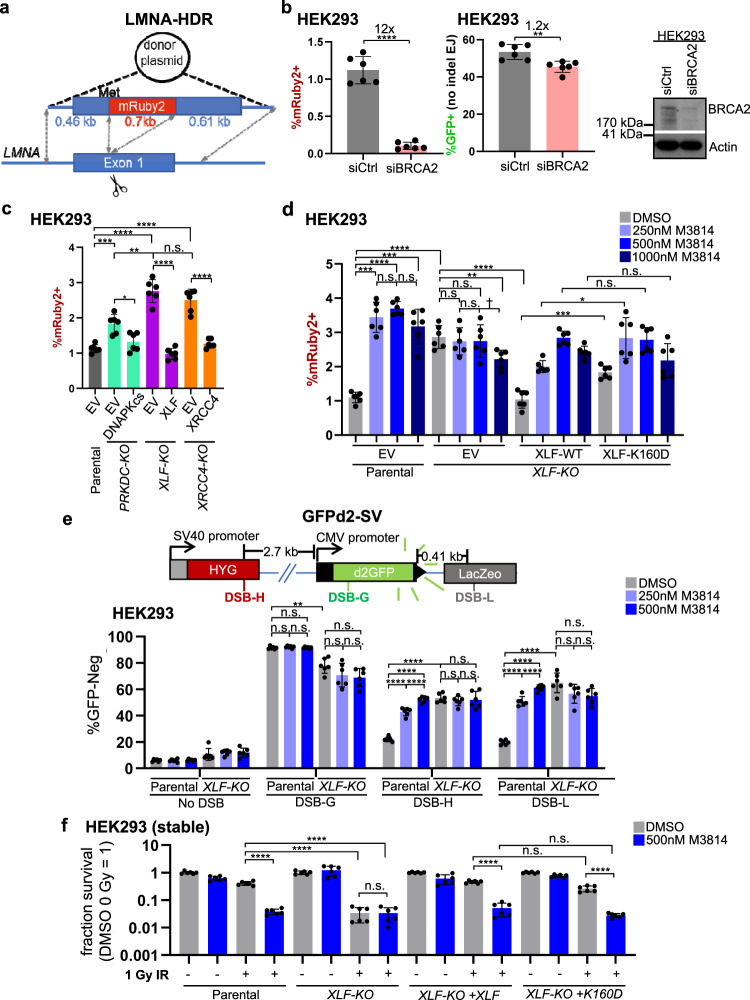
Fig. 6. DNAPKcs kinase inhibition causes an increase in HDR and structural variants (SVs), and IR sensitivity that is not further enhanced by XLF loss.
a Shown is the LMNA-HDR reporter (not to scale) involving a Cas9/sgRNA that induces a DSB in LMNA exon 1, and a plasmid donor such that HDR causes mRuby2 to be expressed from the LMNA locus. The mRuby2 frequencies are normalized to transfection efficiency with parallel GFP transfections. b BRCA2 is required for HDR by the LMNA-HDR assay, but has modest effects on No Indel EJ. Cells were transfected with siRNA that is non-targeting (siCtrl) or targets BRCA2 (siBRCA2). n = 6 biologically independent transfections. Statistics with unpaired two-tailed t test using Holm–Sidak correction. ****P < 0.0001, **P = 0.00305. Immunoblot shows levels of BRCA2. c DNAPKcs, XLF, and XRCC4 suppress HDR to similar degrees. n = 6 biologically independent transfections. Statistics as in (b). ****P < 0.0001, ***P = 0.00069, **P = 0.00117, n.s. not significant. d Suppression of HDR. n = 6 biologically independent transfections. Statistics as in (b). ****P < 0.0001, Parental EV DMSO vs. 1000 nM M3814 ***P = 0.000493, XLF-KO XLF-WT DMSO vs. XLF-K160D DMSO ***P = 0.000404, XLF-KO EV DMSO vs. 1000 nM M3814 **P = 0.0203, XLF-KO XLF-WT 250 nM M3814 vs XLF-K160D 250 nM M3814 *P = 0.0249, †P = 0.0386 but not significant after correction (unadjusted P-value), n.s. not significant. e Suppression of SVs. Shown is the GFPd2-SV reporter (not to scale) that is chromosomally integrated to an FRT site in HEK293 cells. Stable expression of Cas9 and various sgRNAs (DSB-H, DSB-G, and DSB-L) can induce GFP-negative cells (GFP-neg). n = 6. Statistics as in (b). ****P < 0.0001, **P = 0.00136, n.s. not significant. f IR sensitivity. HEK293 stable cell lines were treated with DMSO or M3814, and 0 Gy or 1 Gy IR dose, and plated to form colonies. Fraction clonogenic survival was determined relative to DMSO 0 Gy for each cell line. n = 6 biologically independent wells of seeded cells. Statistics as in (b). ****P < 0.0001, n.s.= not significant. Error bars = SD. Data are represented as mean values ± SD.

