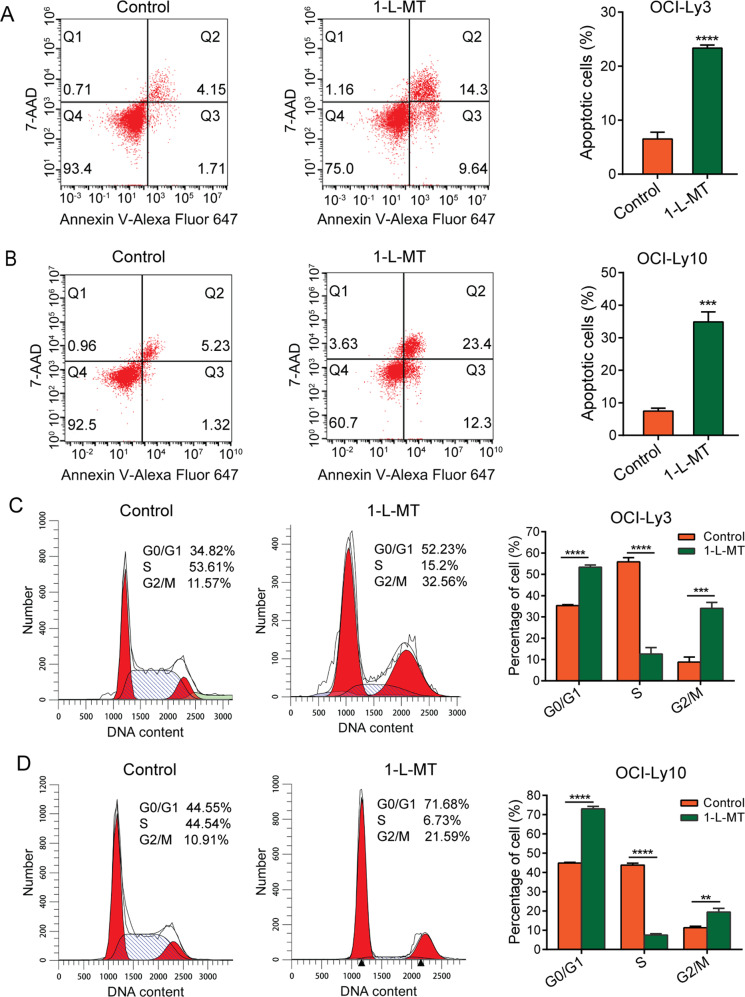
Fig. 4. IDO1 inhibition induced cell apoptosis and G2/M arrest in DLBCL cells.
A, B At 48 h after stimulation with 5 mM 1-L-MT, annexin V-Alexa Fluor 647 and 7-AAD staining was performed. Then, the rate of apoptotic cells was analyzed by flow cytometry in OCI-Ly3 and OCI-Ly10 cells. C, D OCI-Ly3 and OCI-Ly10 cells were treated with 5 mM 1-L-MT for 24 h. Then, the cell cycle distribution was analyzed using flow cytometry. Statistical analysis was analyzed with a two-sided student’s t-test. **P < 0.01, ***P < 0.001 and ****P < 0.0001.

